Transpacific Imports and Port Congestion Woes
Supply Chain Reactions
A Condensed Update For American Shippers
Issue Date: February 15, 2021
Quote of the Issue:
“Being challenged in life is inevitable, being defeated is optional.”
– Roger Crawford
Transpacific Imports Driving Volume Surge and Port Congestion Woes
ShapLight Focus: 2.8M TEUs of containerized cargo were imported into the US in January 2021; this is the second highest total in history
- As ports in North America struggle to off-load vessels (most notably in LA/Long Beach), the steamship lines were forced to void 277,000 TEUs from Asia; this represents 13% of the total February cargo capacity
- The slowdown of vessels returning to Asia is also expected to create an acute shortage of empty containers at origin by early March; this is discouraging news for importers and forwarders who only recently recovered from a prolonged container shortage to end of 2020
- In yet another example of COVID affecting all aspects of supply chain, many factories in China closed early, while many others chose to remain open; please note the following regional factory trends for China:
- Dalian and Tianjin: Most factories closed due to the recent COVID outbreak
- Qingdao: The majority of factories will remain open; trucking coverage is down 50%
- Shanghai and Ningbo: 50% of factories open; trucking power down 60-70%
- Xiamen and Shenzhen: Most factories will remain open
- Between November and January, a whopping 2,675 containers were lost at sea in the Pacific after the steamship industry averaged 1,382 losses for all of 2018 and 2019; while many pundits point to violent weather from global warming, many insiders have expressed concerns about strained ports, ill dock workers, and the real possibility that vessels are being loaded beyond safe levels
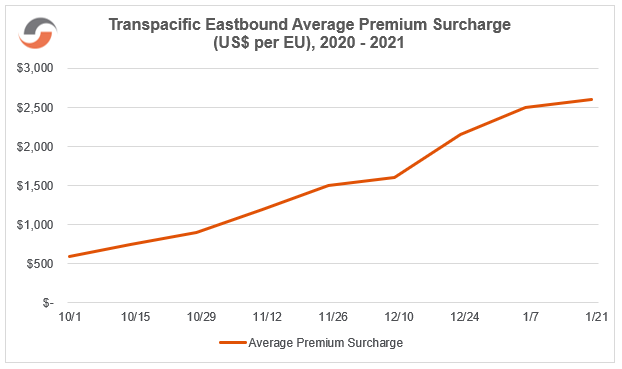
- It is estimated that over 60% of exports from Asia in 2021 have shipped with premium surcharges, despite markedly declining transit reliability industry-wide
Chart of the Issue:
Please note the breathtaking extra costs above FAK levels below:
Gov Corner: Biden Administration Targeting Forced Labor Violations
ShapLight Focus: There are 12 million ethnic Uighurs in China’s Xinjiang province, most of whom are Muslim; this represents nearly half of the total population of Xinjiang
- The US has accused China of committing genocide against the Uighurs; according to the international convention, genocide is defined as “the intent to destroy, in whole or in part, a national, ethnical, racial or religious group”
- Since the Tariff Act of 1930, the US has prohibited the importation of goods determined to be minded, produced, or manufactured, in whole or in part, by the use of forced labor – including prison labor, forced labor, or indentured child labor; the Biden administration has issued withhold release orders (WROs) for cotton and tomatoes imports from Xinjiang with more commodities likely to follow
- The Fish and Wildlife Service (FWS) notified the trade that the agency will begin mandatory ACE filing of FWS-regulated products in June 2021, rather than in March as previously announced
- Effective March 15, CBP will require electronic submission to APHIS of all data elements for APHIS Core regulated products in ACE; it is critical that importers understand the APHIS requirements to import their product ahead of time – that information is provided to your broker with your shipping documents (USDA APHIS Import/Export website)
APHIS-regulated products include:
- Cut Flowers and Greenery
- Animal Products
- Miscellaneous Processed Products
- Live Animals
- Used Agricultural Machinery
- Propagative Materials
- Fresh/Frozen Fruits and Vegetables
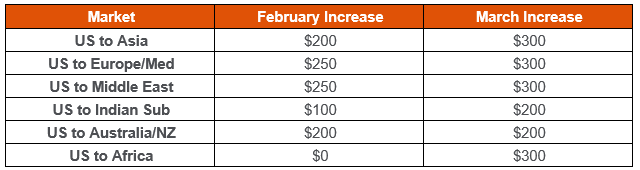
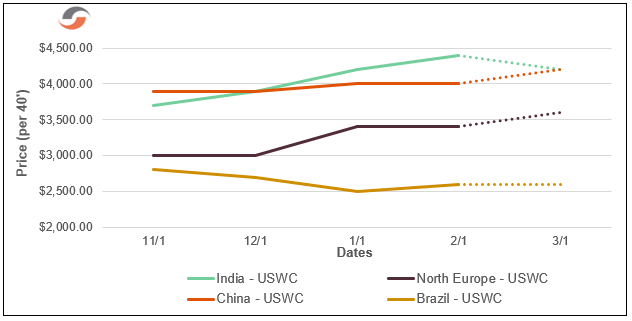
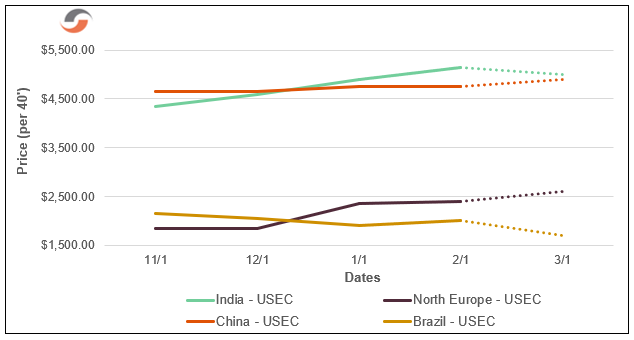
US Exports: Global Equipment Imbalance Driving GRIs
ShapLight Focus: Every major US export trade lane has announced general rate increases (GRIs) for early 2021 as ocean carriers build in costs for re-positioning containers and equipment
- Even as US exporters file complaints with the Federal Maritime Commission (FMC) over the lack of available empty containers and highly frequent rolls at US ports of lading, they now also face rate increases across the globe
Expected US Export GRIs per 40’ by Trade Lane:
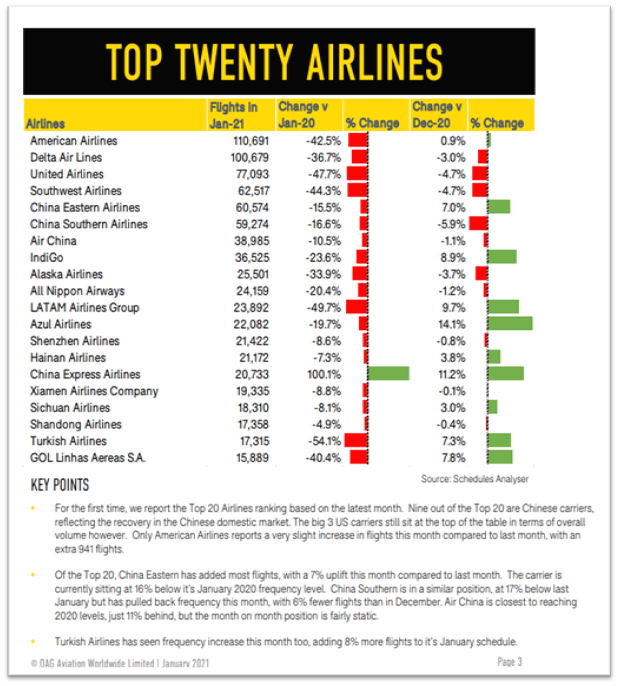
14 of World’s Top 20 Airlines Cut at Least 10% of Flights in 2020
ShapLight Focus: Please note the following charts from the Official Airline Guide (OAG);global reduction in flights is truly sobering, and the resilience of Chinese air carriers is also worthy of note:
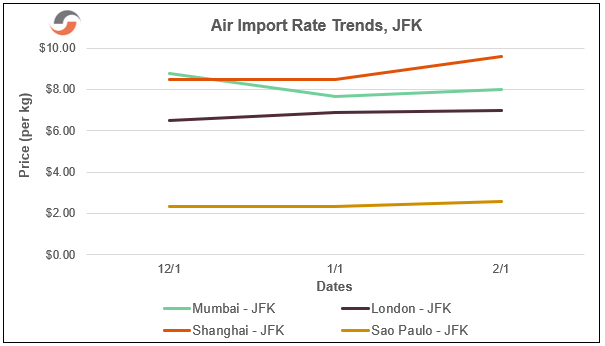
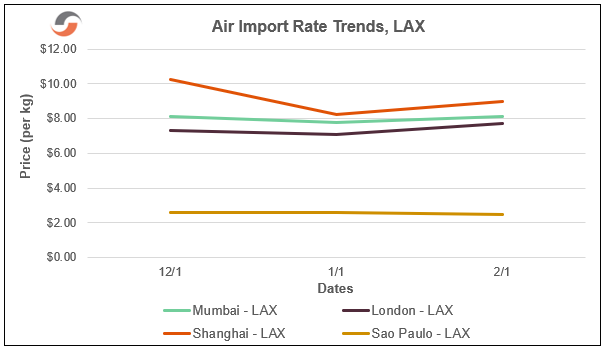
Please note the following three-month airfreight rate trend charts:
Ocean Freight Import Rate Trend Charts
Ocean Import FAK Rates to US West Coast (per 40’):
Ocean Import FAK Rates to US East Coast (per 40’):
Our Expert Shapinion
Why China Won the Trade War Super Bowl in 2020
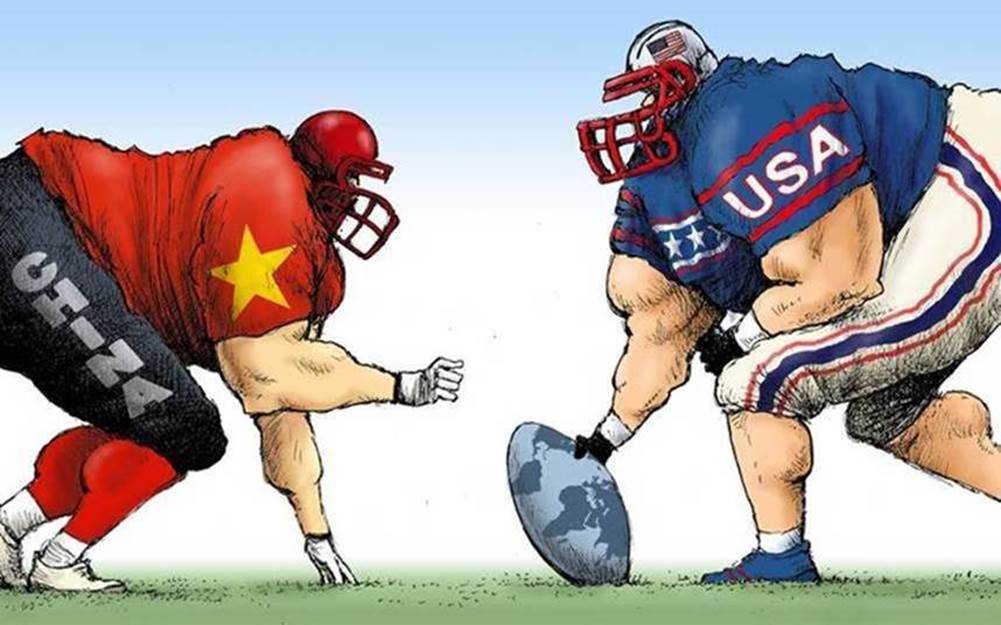
As we say goodbye to America’s football season, we would like to pay tribute to a few classic football cliches while reviewing the big plays on both sides of the ball in the US-China trade war ballgame.
Here are some of the highlights:
To kickoff 2020, the US had just played small-mouth football on Section 301 Tariffs in the 2018 endzone and throughout the 2019 season. It seemed to all that they just needed to stick to their game plan: score lots of points on exports to China and build on the 11% reduction in imports from China. After the US left it all on the field in 2019, China’s market share of US imports had fallen a significant 6 points (a touchdown and a missed extra point).
Frankly, China’s production offense was facing 3rd down and forever with $370B in US tariffs, the doubling of manufacturing wages since 2009, increased social welfare taxes, and stricter environmental compliance gang tackling their prospects for growth in exports to the US.
At the same time, the US made wise draft picks as they marched down the field to diversify sourcing – especially for lower-cost and labor-intensive goods. Vietnam has been running downfield while gaining yardage at nearly 20% growth per year. To boot, the Indian Sub-continent has been able to air it out to give the US good hands for their big-play offense.
So, how did China win the Game of All Games – the Trade War Super Bowl?
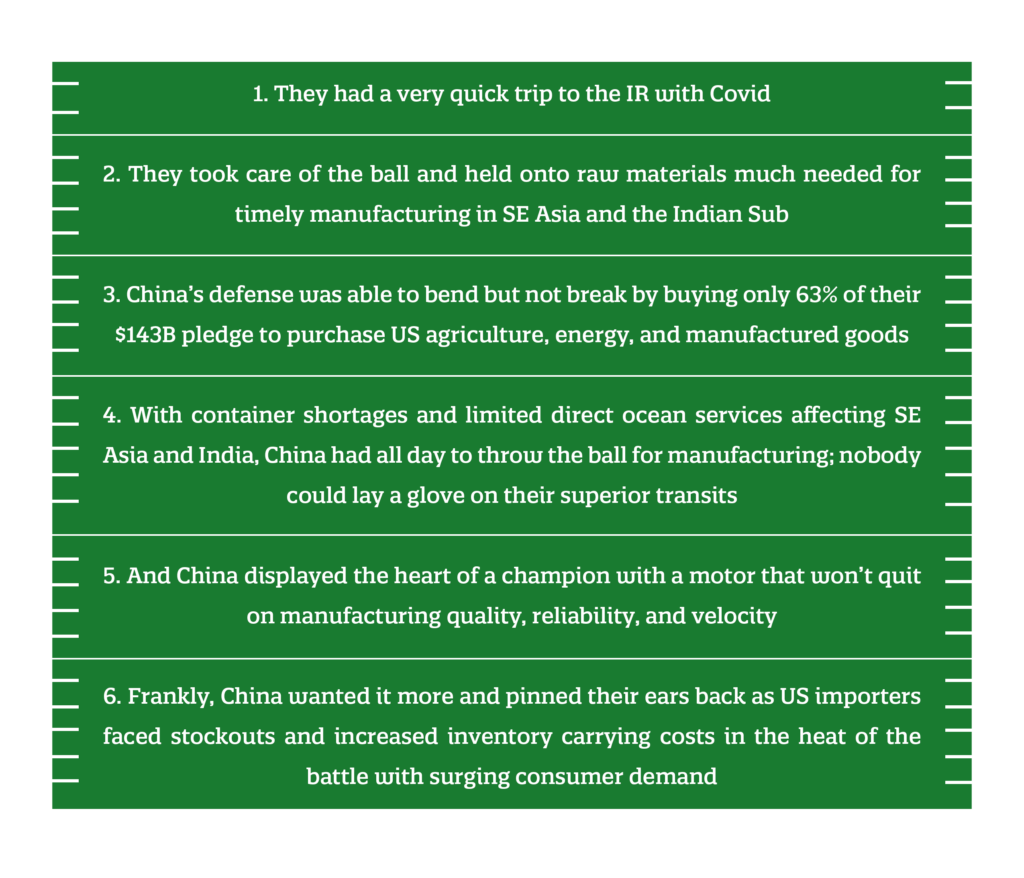
When looking at the second half of 2020, China had a throwback season reminding us all of their glory days as the world’s factory. They have mastered the hurry-up offense for speed, agility, and quality while being able to milk the clock on total transits and production reliability.
Coach Biden will have to carefully review the US playbook this season; a porous defense is missing targets for US exports while China’s ball control offense on manufacturing will sorely test the grit and toughness of US importers previously dedicated to new sourcing options…Game on!
Shap Fact of the Issue:
The Journal of the American Medical Association estimates the US economic cost of COVID-19 to be $16 Trillion in lost output and health reduction. This number is four times larger than losses attributed to The Great Recession, and it is more than twice as large as the cost of wars in Afghanistan, Iraq, and Syria combined.
The leadership and staff of Shapiro understand the personal and business anxiety each of you is experiencing. We want nothing but safety today and a return to normalcy tomorrow for you and your families. Please reach out to us if you have any questions—or if we can assist you in any way.