FTL Trucking Rates Continue to Ramp Up
Supply Chain Reactions
A Condensed Update For American Shippers
Issue Date: October 14, 2020
Quote of the Issue:
“There’s something to be said for sitting still and letting things clear, the way morning fog burns off the lake.”
– George Witte
FTL Trucking Landscape: Record Rates per Mile
ShapLight Focus: In October, FTL trucking rates hit a national average of $2.44 per mile, the highest rate on record and 153% higher than May 2020
- The drayage industry is reeling as port turn times increase, chassis shortages abound, and empty container dislocations diminish driver productivity and profits; the situation is expected to deteriorate further as US port volumes ride the crest of this prolonged peak
- Los Angeles/Long Beach (LA/LB) has reported a 30% increase in on-terminal dwell times, in addition to witnessing off-terminal chassis turn times reach 8 days; this is a recipe for congestion chaos and inevitable delays
- Estimates show that 80% more trucking volumes are moving on spot rates versus contract rates in 2020 compared to 2019; not only has demand been historically erratic due to COVID, but the trucking supply is also out of sync on previously established routes
- Until August, spot rates in 2020 had been below contract rates; at present, they are .15 per mile higher than contract rates
- Diesel fuel prices have been remarkably stable, with costs within a nickel for the last four months; the current average cost per gallon sits at $2.38
- DAT reports that load postings per available truck now sit at a five to one (5:1) ratio, marking the highest level since June 2018; this is a broad indication that demand is out-stripping supply and price increases may be looming
The Gov Corner: Was Section 301 Legal?
ShapLight Focus: Several lawsuits were filed with the US Court of International Trade (CIT) targeting the legality of Lists 3 and 4A for Section 301 tariffs on Chinese goods
- If successful, these lawsuits could result in the refund of all Section 301 tariffs levied on List 3 and 4A goods over the past two (2) years and up until the case is resolved, regardless of whether an exclusion was previously available or filed by an importer
- It has been recommended that importers file their own independent lawsuits to ensure eligibility for any refunds that may arise due to the CIT lawsuit
- The statute of limitations is two (2) years from the date of the cause of action; there is an argument that the applicable date is the date the duties were paid (which means the deadline becomes a rolling timeline)
- As a general matter, CBP uses the liquidation process for the issuance of duty refunds; in addition to filing suit with the CIT, it may be wise for importers to further protect their interests by either requesting liquidation be suspended or protesting the liquidation of entries
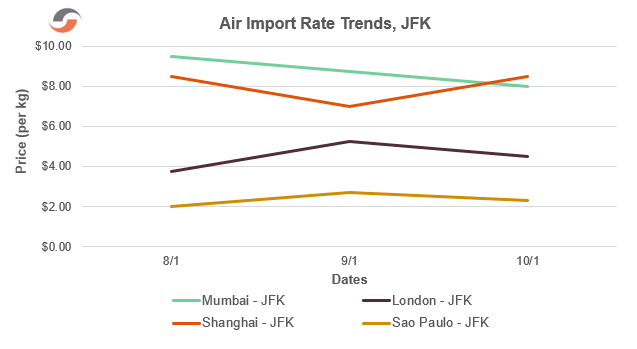
Airfreight Turbulence: Spiking Demand with Uneven Supply
ShapLight Focus: Average air rates remained above $8 per kg from India and returned above $8 per kg from China to the US
- Globally, airlines are struggling with a lack of passenger demand, which is negatively affecting available cargo capacity supply
- India air rates have remained high, mostly as a result of the tremendous equipment shortages and delays in the ocean freight supply chain; the resulting cargo back-log is expected to persist throughout 2020
- Chinese airfreight supply, already under pressure from continued personal protective equipment (PPE) shipping, is expected to come at a premium as US retailers look to ship holiday goods much earlier than past years; in particular, shipments of new-era smartphones and gaming consoles are expected to dominate air shipping from China
- Transportation Security Administration (TSA) reports that US passenger traffic remains almost 70% lower in October 2020 than it was in October 2019
- All eyes are on the overall financial health of the airline industry; even as cargo demand spikes, airlines are forced to seek government subsidies and assistance to help them recover from massive losses in passenger revenue
Please note the following three-month airfreight rate trend chart:
Ocean Carriers: Full Steam Ahead on Profits!
ShapLight Focus: The top 10 global ocean carriers reported an average Q2 operating margin of 8.5% after achieving 2.6% in Q1 and 1.9% for all of 2019; this is the best result for the sector since 2010
- Industry experts estimate that a mind-blowing 10% of China’s ocean exports are now moving on “premium” services, which cost between $300 and $1200 extra per container; the industry average for “guaranteed” or “premium” services is $750 per 40’
- For the first time in 5 years, every major global steamship line was profitable in Q2 2020 (including HMM!); with ocean rates hitting record levels in Q3, there is no reason to expect diminished results when final financials are announced
- The steamship industry suffered its fourth major cyber-attack as CMA fought to recover from a ransomware assault on September 28; Maersk (2017), COSCO (2018), and MSC (April 2020) preceded CMA in fighting major system breaches
- The shipping trade has expressed serious concerns about carrier cyber-security overall; the mix of ships that the lines either own or charter for long periods of time – and share within alliances – complicates any concept of having standardized cybersecurity strategies fleetwide
- Although CMA announced a full recovery of online services after two weeks of manual bookings, they requested a 60-day grace period with the FMC to straighten out rate filings and paperwork
- Maersk will phase out its Safmarine and Damco brands by the end of this year, targeting a simplification of the customer interface; under the reorganization, the Safmarine brand will be integrated into Maersk, while Damco’s air and LCL business will be combined with Maersk’s logistics and services products
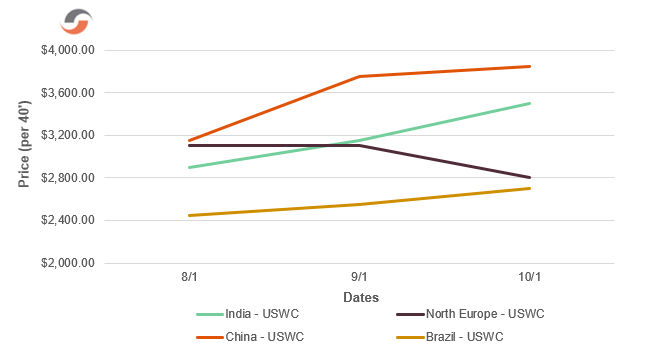
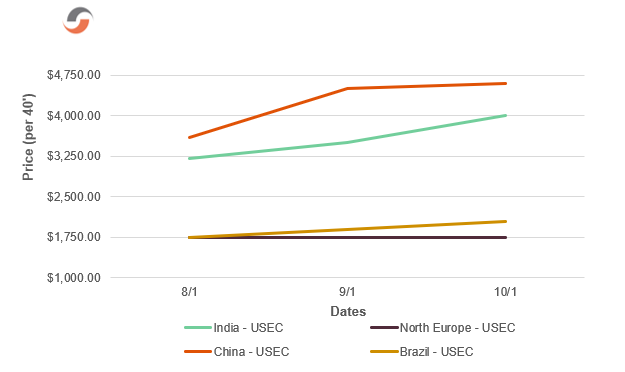
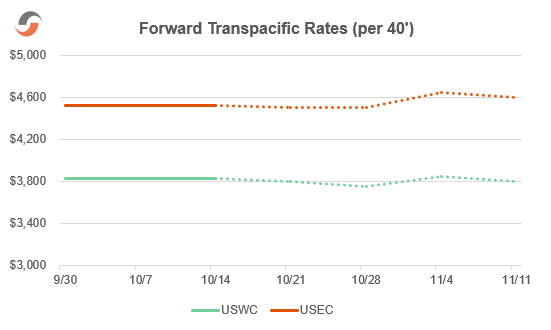
Ocean Freight Import Rate Trend Charts
Ocean Import Rates to US West Coast (per 40’):
Ocean Import Rates to US East Coast (per 40’):
Ocean Freight – Chart of the Issue:
Our Expert Shapinion
Demanding an Explanation for September’s Transpacific Surge
At this point, we have all read a lot about the supply side in 2020. We have watched ocean carriers repeatedly blank sailings, idle ships, and deliberately launch extra loaders to move backlogged and rolled cargoes from Asia. In September, we welcomed a much-needed feeling of hope as weekly capacity from China reached a record-breaking 530,000 TEUs. Then, our frustrations returned as the Golden Week slow-down provoked carriers to blank nearly 20% of capacity for the week starting October 5 and a total of 130,000 TEUs for the month of October. However, the staggering year-over-year increases in imports – 198% to the US East Coast and 294% to the US West Coast — cannot be explained by supply alone.
Please have a look at the following motley chart of demand increases from 2019 to 2020:
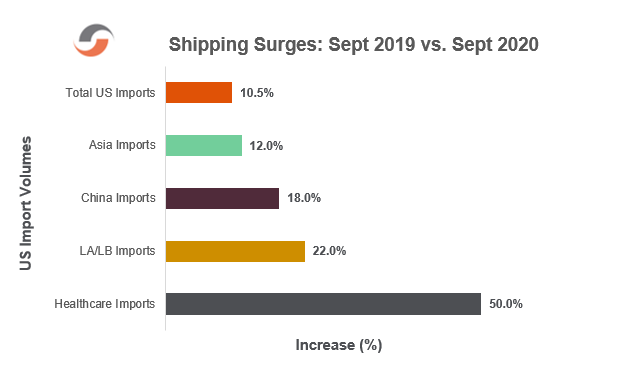
Fueled by demand increases since June, the Transpacific peak season continues to chug along and shows little evidence of slowing down, despite very mixed macroeconomic and COVID news in the US and internationally. Let’s take a closer look at the industry verticals with strong demand:
- Personal Protective Equipment (PPE) – roughly 10% of total current volumes
- Healthcare shipping – up 50% vs. 2019
- Home furnishings and household appliances – up more than 50%
- Consumer staples – up 29.1% and still rising
- Consumer discretionary spending (including electronics and gifts)— up 25%
- Industrial goods – up 13.7%
At the end of the day, there are three main fuels for the demand surge:
- The COVID effect
- E-commerce growth and emphasis
- An untraditional front-loaded shipping reality for the 2020 holiday season
It now seems obvious that the experience of being short on PPE and healthcare products was an intolerable reality for Americans, the healthcare industry, and the suppliers of those products. Additionally, many companies have begun to market and sell these types of products as a means of drawing consumers to their stores (virtual or not); this demand remains strong.
But, the most profound effect of COVID (and US social unrest more broadly) is reflected in the staggering demand for home furnishings and household appliances. Spurred in part by historically low interest rates and driven to the safety of the suburbs, Americans are buying and selling real estate and furnishing those homes. And, for those staying home, they simply cannot bear the sight of that sofa for one more day (and they have that refi money to spend). It’s important to note one more factor – shipments of home furnishings and appliances are bulky and require a lot of containers for movement. So, the question is, how long can this demand persist?
E-commerce supply chains require faster transits and more inventory to succeed. As we watch American retailers re-invent themselves, we see more and more importers emphasizing the USWC and especially LA/LB terminals – which now handle 54% of imports from Asia and an even greater percentage from China. While this segment is here to stay and will continue to grow, one imagines that once inventory levels reach critical mass, the emphasis on the USWC will lessen at least slightly. This leads us to the holiday shipping season for 2020…
Retailers expect consumers to do their holiday shopping earlier than usual for both in-person and online purchases. The argument is that shopping early helps people avoid crowds, courier surcharges and delays, and potential out-of-stock realities. Also, there is some evidence that people will want to spoil loved ones a bit after avoiding vacation and other travel expenses during COVID. With October replacing Black Friday (late November), we could be seeing a more temporary demand surge today, which basically amounts to front-loading the typical holiday peak.
On October 1st, we celebrated the first month without a general rate increase (GRI) in five months. We have endured 8 GRI increases since May 1st; each one has averaged $329/FEU (as depicted in the Ocean Freight – Chart of the Issue). Surely, this MUST be evidence of a market slow-down, right? Not so fast. When you look closely at what ocean carriers are saying, they seem more worried about regulatory scrutiny from China’s MOT and the US FMC than modest rate gains for now.
Considering October’s blank sailings and the continued demand strength across so many industry verticals, in e-commerce, and the upcoming holiday season, it looks like we need to prepare for a peak season that maintains strength through the remainder of 2020.
Shap Fact of the Issue:
A San Francisco company, formerly called Pizza to the Polls and designed to deliver ‘za to people standing in line to vote, has profoundly pivoted and is now called Power to the Polls. The new organization has recruited 450,000 young people (and counting) to replace traditional American pollsters – 70% of whom are retirees – who will be sitting out the 2020 election amid serious COVID-19 health concerns.
The leadership and staff of Shapiro understand the personal and business anxiety each of you is experiencing. We want nothing but safety today and a return to normalcy tomorrow for you and your families. Please reach out to us if you have any questions—or if we can assist you in any way.