Supply Chain Reactions
A Condensed Update For American Shippers
Issue Date: March 23, 2021
Quote of the Issue:
“Gratitude, like faith, is a muscle. The more you use it, the stronger it grows.”
– Alan Cohen.
Paying More for Less Reliability with Freight Services
ShapLight Focus: US importers paid $5.19B in freight services during February 2021, up from $1.95B in February 2020
- 2021 YTD carrier schedule reliability remains at historically low levels; currently, fewer than 20% of vessels are arriving on time to the US
- In March, approximately 200,000 TEU of capacity were ‘operationally’ blanked; this represents over 18% of Asia-US capacity
- 2020 Steamship Profit Highlights:
- Maersk produced $2.9B in profits for 2020
- ONE expects to hit $2.5B in 2020 net profit
- Hyundai, which has lost money for more than a decade, reported 2020 record-breaking profits of $830M, which is more than a $1B turnaround from 2019 results
- Continuing an alarming trend, the Maersk Eindhoven suffered propulsion failure, resulting in the loss of 260 containers overboard and damage to an additional 65
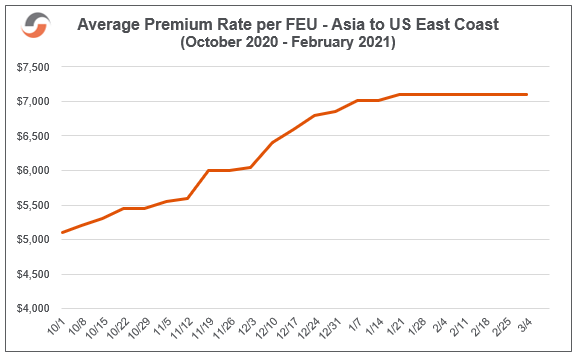
- Although the cost per FEU continues to be truly eye-popping, the average cost of a premium container from Asia to the US East Coast (USEC) has been stable since mid-January
Chart of the Issue:
Please see the chart of the issue below:
Gov Focus: Biden Administration Softens 301 Stance with Europe
ShapLight Focus: By value, US trade with the EU is 13% greater than with China; a total of
$720B of goods and services are exchanged with the EU compared to $635B with China
- Effective March 11th, Section 301 tariffs on EU products – including wines, liquors, and foodstuffs – were suspended for four months to give negotiators further time for review
- It appears that the now infamous squabble between the EU and the US over aircraft and aircraft parts may finally be nearing a resolution in light of the decision to temporarily suspend the 15% levy on these commodities
- The final phase of APHIS Core integration with ACE began March 15, 2021
- On March 4th, all Section 301 tariffs for products from the United Kingdom (UK) were lifted; they will remain suspended at least until the US celebrates our independence from the UK
Airline Financial Woes to Continue in ’21 Despite Positive Cargo News
ShapLight Focus: The International Air Transport Association (IATA) estimates the airline industry will lose between $75B to $95B in 2021 due to lost passenger volumes and revenues
- Between January and February 2021, air cargo demand has matched demand for the same months in 2020; these are the first months not showing a decline since the onset of the pandemic
- While demand has been flat compared to a year ago, global airfreight rates have increased by almost 75% year-on-year
- Because of significantly diminished passenger aircraft belly space (which provides roughly 50% of total global air capacity), YTD air cargo load factors are up almost 20% in 2021
- Asia and the United States are the only regions globally showing year-on-year growth as an air cargo origin; the US Midwest has expanded volumes by an impressive 13%
- Express package shipping is up 40% year-on-year globally
- In normal times, 33% of world trade by value ships by air
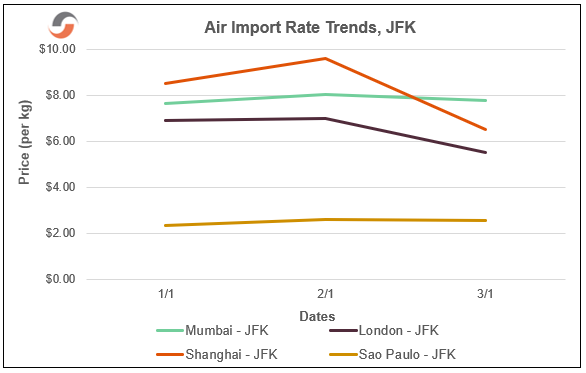
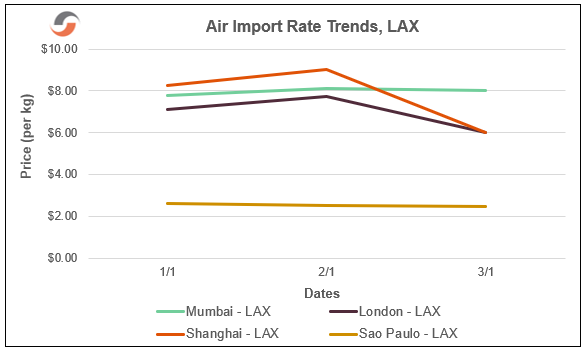
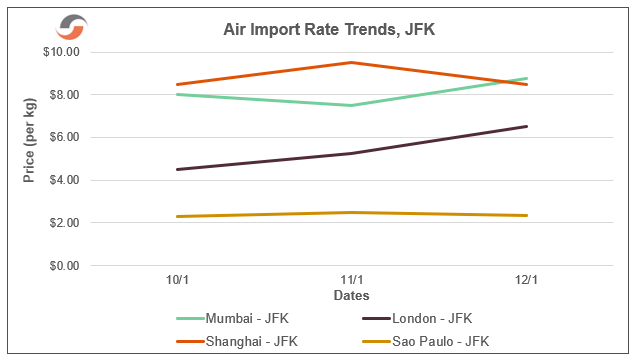
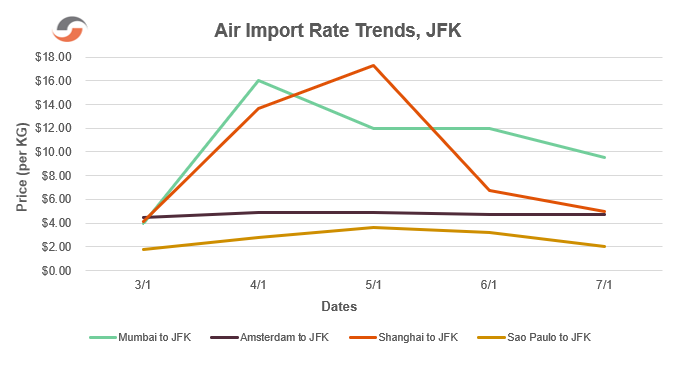
Please note the following three-month airfreight rate trend charts:
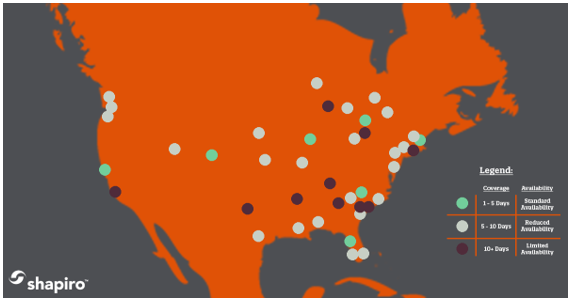
Poor Trucking Supply + Equipment Dislocation + Congested Ports = Importers & Exporters Seeking Therapy and Hair Loss Remedies
ShapLight Focus: Please see our map of average dwell times throughout US ports below:
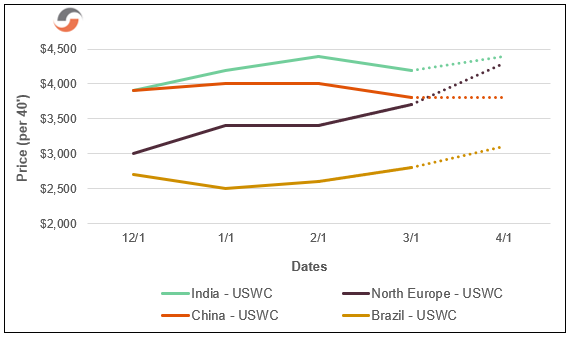
Ocean Freight Import Rate Trend Charts
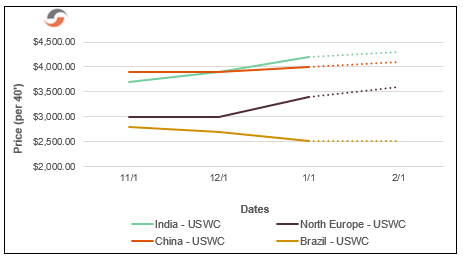
Ocean Import FAK Rates to US West Coast (per 40’):
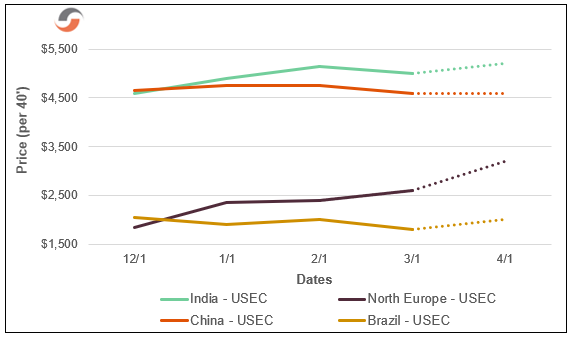
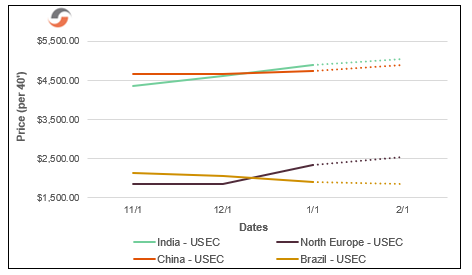
Ocean Import FAK Rates to US East Coast (per 40’):
Our Expert Shapinion
7 Reasons Importers Might Just Roll a ‘7’ in the Shipping Game of Craps in ’21
In 2020, every importer became a gambler. You high-rollers know that rolling a ‘7’ at the Craps table is great on your opening roll (called the ‘come-out roll’) but is deadly thereafter. And, let’s face it, could there be a better metaphor for what is happening today than ‘Craps’…?!
So today, we’ll look closely at the circus of economic possibilities, the carnival of carrier realities, and the casino of 2021 freight negotiations to understand who might have the hot hand, the best cards, or the all-powerful ‘ace in the hole.’

The Argument for Winning 7 in Shipping Craps:
- All bets were off in the US services economy during the pandemic as Americans placed our purchase power wagers on goods (especially durable goods). In normal times, we put our money where our mouth is – restaurants – and double down on travel, entertainment, gyms, etc., and spend $8.5 trillion on services annually. Placing our chips on services should slow demand for goods (which grew to $4.5 trillion in 2020).
- In 2020, importers of personal protective equipment (PPE) hit the jackpot, as all of us in the global casino donned masks and wrung our hands with sanitizer (to say nothing of the equipment and medical supplies needed by the heroes in the medical field). The smart money is on a diminishment in PPE for 2021.
- Somewhat quietly, manufacturers have been forced to bet the farm on raw materials with costs doubling for many essentials. This will certainly up the ante on the costs for imported goods.
- Ironically, the steamship industry’s hot hand on rates and playing the percentages on capacity controls essentially doubled ocean shipping costs. As retail rates rise, US consumers will eventually say ‘no dice’ and reduce consumption.
- Three true tycoons of the Global Gaming House aspire to have the tallest stacks of chips on planet Earth…Maersk, MSC, and COSCO. And very quietly these fat cats, and others, have announced new services or upgrade plans for existing strings. Aspirations to be #1 must eventually sweeten the pot of capacity – and that pot is already being slowly sweetened in 2021.
- Economists are playing the percentages that the US dollar will weaken in 2021. This is lousy luck of the draw for the relative cost of imported merchandise.
- The US federal deficit is at record levels as a percentage of GDP; this very well could stack the cards against consumers through high taxation and a sputtering broader economy.
Speed Round Reasons for a Losing 7:
- Yesterday’s demand is still with us in the form of cargo backlogs.
- $1400 stimulus checks are hitting US bank accounts at just the right time for consumer spending.
- Get rid of those sweatpants (PLEASE!); apparel should boom again.
- Auto parts and other parts and accessories should rise to complement increased travel.
- As the restaurant trade wakes up, booze and food imports will remain strong.
- Ecommerce shipping is here to stay, and imports fuel that segment.
- Americans are still moving, selling houses, buying houses, and deciding where to live…this tends to propel sales of furniture, appliances, household goods, and home repair items.
It is a safe bet that we will be paying more to stay at the shipping table in 2021 than we THOUGHT we’d be paying 2020. But, if you play your cards right, you will pay significantly less than you ACTUALLY PAID in 2020. Your aces in the hole are keeping a percentage of cargo for FAK side bets later in 2021 and learning all the gaming rooms in the casino.
In 2021, you need more carriers and more NVOs in the mix to improve your odds for cost and cargo flow success. We are down to the wire on contract season at a time that is undeniably in the ocean carriers’ favor. However, you can be Cool Hand Luke by not over-committing to a bad hand… in fact, you might just be the winner, winner chicken dinner in this madhouse shipping casino.
Shap Fact of the Issue:
Of the 17 million shipping containers in the world, only 6 million are currently being used for shipping or practical purposes; remarkably, only 35% of the global fleet of containers is in use.
The leadership and staff of Shapiro understand the personal and business anxiety each of you is experiencing. We want nothing but safety today and a return to normalcy tomorrow for you and your families. Please reach out to us if you have any questions—or if we can assist you in any way.
Up Next: The Worst Suez Market Allocation ‘Ever Given’
Supply Chain Reactions
A Condensed Update For American Shippers
Issue Date: February 15, 2021
Quote of the Issue:
“Being challenged in life is inevitable, being defeated is optional.”
– Roger Crawford
Transpacific Imports Driving Volume Surge and Port Congestion Woes
ShapLight Focus: 2.8M TEUs of containerized cargo were imported into the US in January 2021; this is the second highest total in history
- As ports in North America struggle to off-load vessels (most notably in LA/Long Beach), the steamship lines were forced to void 277,000 TEUs from Asia; this represents 13% of the total February cargo capacity
- The slowdown of vessels returning to Asia is also expected to create an acute shortage of empty containers at origin by early March; this is discouraging news for importers and forwarders who only recently recovered from a prolonged container shortage to end of 2020
- In yet another example of COVID affecting all aspects of supply chain, many factories in China closed early, while many others chose to remain open; please note the following regional factory trends for China:
- Dalian and Tianjin: Most factories closed due to the recent COVID outbreak
- Qingdao: The majority of factories will remain open; trucking coverage is down 50%
- Shanghai and Ningbo: 50% of factories open; trucking power down 60-70%
- Xiamen and Shenzhen: Most factories will remain open
- Between November and January, a whopping 2,675 containers were lost at sea in the Pacific after the steamship industry averaged 1,382 losses for all of 2018 and 2019; while many pundits point to violent weather from global warming, many insiders have expressed concerns about strained ports, ill dock workers, and the real possibility that vessels are being loaded beyond safe levels
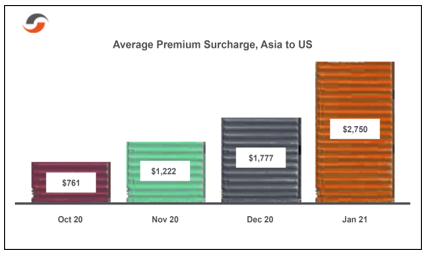
- It is estimated that over 60% of exports from Asia in 2021 have shipped with premium surcharges, despite markedly declining transit reliability industry-wide
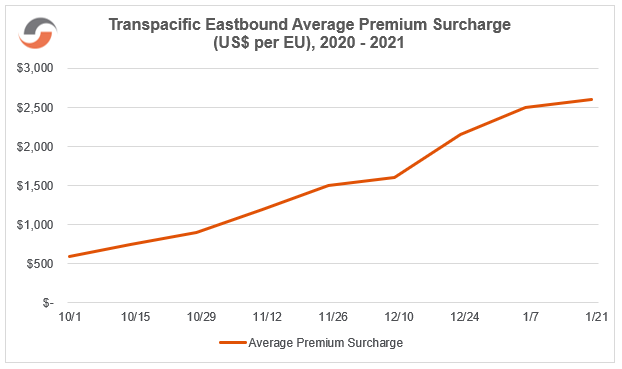
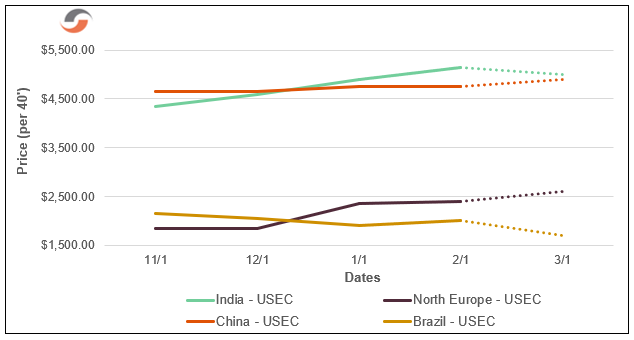
Chart of the Issue:
Please note the breathtaking extra costs above FAK levels below:
Gov Corner: Biden Administration Targeting Forced Labor Violations
ShapLight Focus: There are 12 million ethnic Uighurs in China’s Xinjiang province, most of whom are Muslim; this represents nearly half of the total population of Xinjiang
- The US has accused China of committing genocide against the Uighurs; according to the international convention, genocide is defined as “the intent to destroy, in whole or in part, a national, ethnical, racial or religious group”
- Since the Tariff Act of 1930, the US has prohibited the importation of goods determined to be minded, produced, or manufactured, in whole or in part, by the use of forced labor – including prison labor, forced labor, or indentured child labor; the Biden administration has issued withhold release orders (WROs) for cotton and tomatoes imports from Xinjiang with more commodities likely to follow
- The Fish and Wildlife Service (FWS) notified the trade that the agency will begin mandatory ACE filing of FWS-regulated products in June 2021, rather than in March as previously announced
- Effective March 15, CBP will require electronic submission to APHIS of all data elements for APHIS Core regulated products in ACE; it is critical that importers understand the APHIS requirements to import their product ahead of time – that information is provided to your broker with your shipping documents (USDA APHIS Import/Export website)
APHIS-regulated products include:
- Cut Flowers and Greenery
- Animal Products
- Miscellaneous Processed Products
- Live Animals
- Used Agricultural Machinery
- Propagative Materials
- Fresh/Frozen Fruits and Vegetables
US Exports: Global Equipment Imbalance Driving GRIs
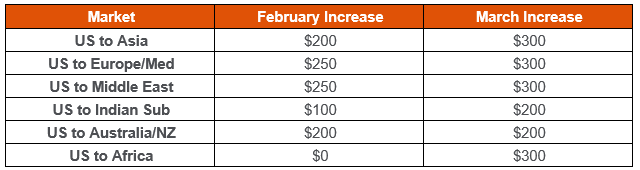
ShapLight Focus: Every major US export trade lane has announced general rate increases (GRIs) for early 2021 as ocean carriers build in costs for re-positioning containers and equipment
- Even as US exporters file complaints with the Federal Maritime Commission (FMC) over the lack of available empty containers and highly frequent rolls at US ports of lading, they now also face rate increases across the globe
Expected US Export GRIs per 40’ by Trade Lane:
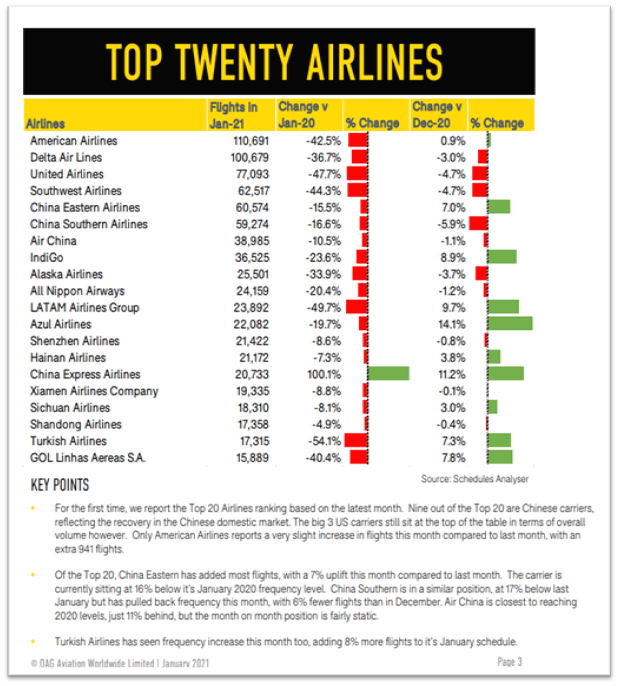
14 of World’s Top 20 Airlines Cut at Least 10% of Flights in 2020
ShapLight Focus: Please note the following charts from the Official Airline Guide (OAG);global reduction in flights is truly sobering, and the resilience of Chinese air carriers is also worthy of note:
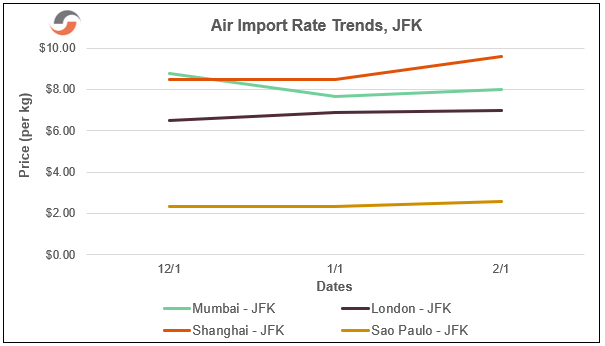
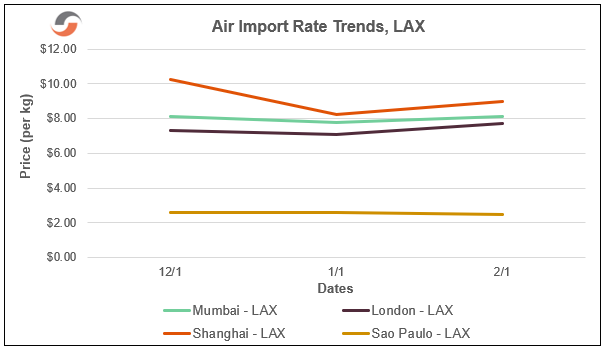
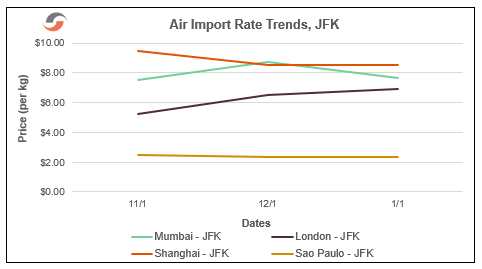
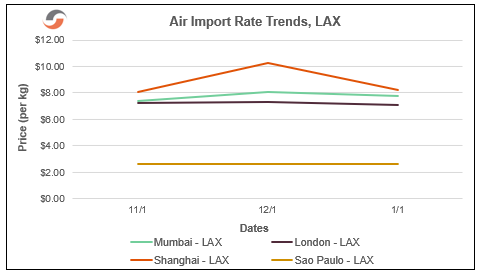
Please note the following three-month airfreight rate trend charts:
Ocean Freight Import Rate Trend Charts
Ocean Import FAK Rates to US West Coast (per 40’):
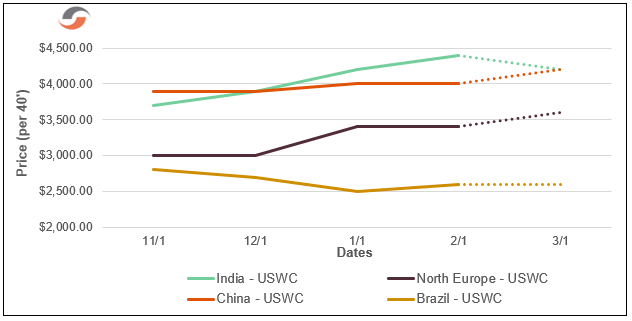
Ocean Import FAK Rates to US East Coast (per 40’):
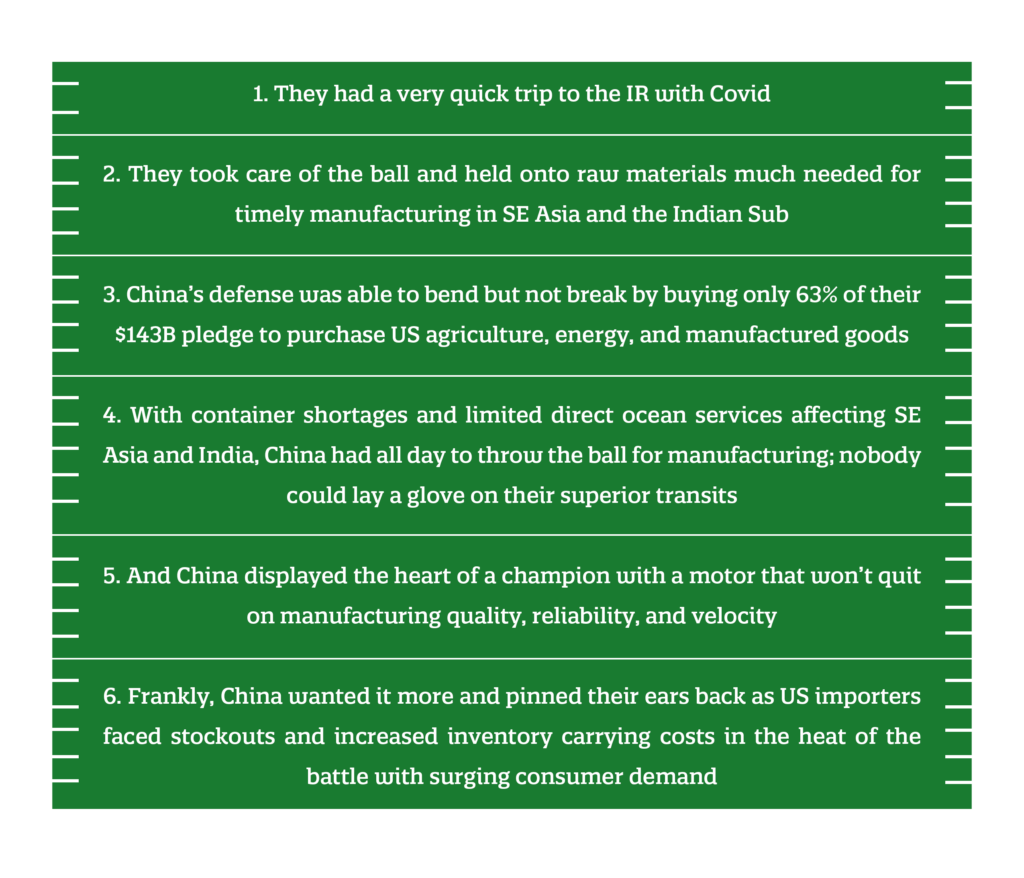
Our Expert Shapinion
Why China Won the Trade War Super Bowl in 2020

As we say goodbye to America’s football season, we would like to pay tribute to a few classic football cliches while reviewing the big plays on both sides of the ball in the US-China trade war ballgame.
Here are some of the highlights:
To kickoff 2020, the US had just played small-mouth football on Section 301 Tariffs in the 2018 endzone and throughout the 2019 season. It seemed to all that they just needed to stick to their game plan: score lots of points on exports to China and build on the 11% reduction in imports from China. After the US left it all on the field in 2019, China’s market share of US imports had fallen a significant 6 points (a touchdown and a missed extra point).
Frankly, China’s production offense was facing 3rd down and forever with $370B in US tariffs, the doubling of manufacturing wages since 2009, increased social welfare taxes, and stricter environmental compliance gang tackling their prospects for growth in exports to the US.
At the same time, the US made wise draft picks as they marched down the field to diversify sourcing – especially for lower-cost and labor-intensive goods. Vietnam has been running downfield while gaining yardage at nearly 20% growth per year. To boot, the Indian Sub-continent has been able to air it out to give the US good hands for their big-play offense.
So, how did China win the Game of All Games – the Trade War Super Bowl?
When looking at the second half of 2020, China had a throwback season reminding us all of their glory days as the world’s factory. They have mastered the hurry-up offense for speed, agility, and quality while being able to milk the clock on total transits and production reliability.
Coach Biden will have to carefully review the US playbook this season; a porous defense is missing targets for US exports while China’s ball control offense on manufacturing will sorely test the grit and toughness of US importers previously dedicated to new sourcing options…Game on!
Shap Fact of the Issue:
The Journal of the American Medical Association estimates the US economic cost of COVID-19 to be $16 Trillion in lost output and health reduction. This number is four times larger than losses attributed to The Great Recession, and it is more than twice as large as the cost of wars in Afghanistan, Iraq, and Syria combined.
The leadership and staff of Shapiro understand the personal and business anxiety each of you is experiencing. We want nothing but safety today and a return to normalcy tomorrow for you and your families. Please reach out to us if you have any questions—or if we can assist you in any way.
Up Next: US Importers Sink $5.19B into Freight Services
Supply Chain Reactions
A Condensed Update For American Shippers
Issue Date: January 15, 2021
Quote of the Issue:
“You can’t calm the storm, so stop trying. What you can do is calm yourself. The storm will pass.”
– Timber Hawkeye
US Domestic: Port and Rail Congestion Crippling Service Levels
ShapLight Focus: Dray carriers are requiring bookings at least 12 days in advance for Savannah, Norfolk, Baltimore, New York, Atlanta, and Memphis
- Average truck turn times at major US ports have increased every single month since June
- Surging import volumes, dysfunctional port operations, and chassis imbalances have led to rail delays of 17 days in Los Angeles and 9 days in New York
- Drayage rates spiked in December and are expected to do so again in January as trucking operations are unable to complete jobs efficiently
- In three months, diesel fuel rates have increased 5%, which will affect fuel surcharges in early 2021
- DAT reports that there were 4.21 loads per available FTL truck at the end of December; this index has now exceeded both 2018 and 2019 levels for the same months for six months in a row
Government Corner: Will Trump Impose 301 Tariffs Globally?!
ShapLight Focus: Through the office of the US Trade Representative (USTR), the Trump Administration has announced possible 301 actions against Turkey, India, Italy, and France; however, they also delayed the imposition of additional duties (25%) on French luxury goods
- The Federal Maritime Commission (FMC) continues to investigate the role ocean carriers are playing in restricting empty containers that US exporters need in order to ship their products; the carriers prefer to quickly transport empty containers back to Asia where freight rates are at historic highs
- The Trump Administration designated Cuba as a state sponsor of terrorism; this will almost certainly halt all commercial trade between the US and Cuba for the foreseeable future
- The Generalized System of Preferences (GSP) and Miscellaneous Trade Bill (MTB) programs have expired and are not expected to be renewed until well into 2021; though the additional duties are expected to be refunded retroactively, the added strain on importers’ cash coincides with tripled freight costs in many markets
- The vast majority of 301 duty exclusions have now expired, with only PPE products continuing to be eligible for exemptions
Airline Cargo Revenues are Up, though Volumes are Down
ShapLight Focus: Total airfreight volume was down 12.6% in 2020 vs 2019 while revenue yields were up 11.2%; with the loss of passenger belly space diminishing capacity by more than 25%, airlines were able to raise freight rates by 28% in 2020
- The trade expects the block space agreement (BSA) system to re-emerge in 2021; airlines are beginning to offer monthly and quarterly pricing through BSAs, after shifting to a daily spot rate environment in 2020
- Industry pundits estimate that COVID vaccine transportation will account for just 2% of total air cargo volume in 2021
- The International Air Transport Association (IATA) announced that they do not expect the passenger fleet grounded by the pandemic to return to its previous scale until 2024
- Amazon has purchased 11 Boeing cargo airplanes and plans to add them to their transportation network by 2022
- Qatar Airways and China Airlines are the latest airlines to add 777 freighters to their fleets; the industry has quietly witnessed a 10% increase in freighter capacity as airlines position themselves to survive in 2021 on freight operations
Please note the following three-month airfreight rate trend charts:
Sea Ports and Ocean Carriers Setting Volume Records
ShapLight Focus: 1.96 million import containers are projected to arrive at major US ports in January per Global Port Tracker; this is the highest total recorded in US history
- The Chinese government is encouraging factories in South China to release workers early for Chinese New Year (CNY) in an attempt to limit COVID exposure; this is highly unwelcome news for US importers already facing tremendous supply chain delays and costs
- Note: Chinese citizens are expected to make 3 billion trips during CNY (2.5 billion by car or bus, 450 million by train, and 50 million by air)
- After blanking 20% of capacity during CNY in early 2020, the steamship industry has announced blank sailings representing just a 2% reduction in shipping capacity to date
- There are currently 35 cargo ships at anchor awaiting berths at the ports of Los Angeles/Long Beach (LA/LB)
- The industry has witnessed ocean carrier “slidings” in lieu of blank sailings; the carriers have been forced to stretch sailing schedules and swap origin and destination ports on established routes to adjust to extreme port congestion and dislocated equipment realties
- It has been a violent winter in the Pacific Ocean, and at least four vessels have been damaged and lost containers overboard thus far
Ocean Freight Import Rate Trend Charts
Ocean Import FAK Rates to US West Coast (per 40’):
Ocean Import FAK Rates to US East Coast (per 40’):
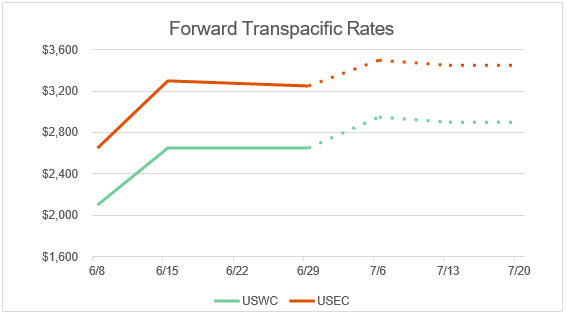
Transpacific Forward Rate Projections (per 40′):
Our Expert Shapinion
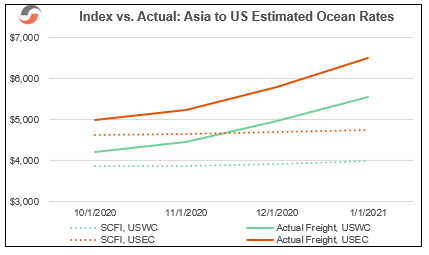
The Shanghai Containerized Freight Index is Meaningless
Since 2005, most importers and forwarders have been using the Shanghai Containerized Freight Index (SCFI), and most of us have come to trust the index to help us understand if our contracts and rates are competitive. In fact, many importers establish contract rules with NVOs and forwarders that depend on our trusted friend – the Shanghai Index.
The unprecedented shipping realities starting in October 2020 and powerfully accelerating through December and into 2021 have claimed another victim. The SCFI is currently meaningless.
How can it be? How can one of our truly beloved market tools become irrelevant in a mere two or three months?
The answer, my friends, is blowing in the wind of premium surcharges. And “surcharge” is the key word here.
Somewhat cleverly, ocean carriers have rebranded ocean freight as a premium surcharge. Not only does this remove some governmental scrutiny over rates, but it also helps importers feel that they are receiving something special for their (piles and piles of) money. At the end of the day, however, premium surcharges are just a form of ocean freight. And frankly, only two or three ocean carriers should be allowed to call what they are selling a “premium” service.
Two things have happened to make the SCFI irrelevant:
- We now see over 60% of the container volume moving on premium services (with premium surcharges), with approximately 30% still moving on historically high FAK rates and 10% on fixed rate service contracts.

- Those premium surchages have Tripled in the last two months.
So, at present, the SCFI is a valid measure for less than one-third of imports from China, and our reliance on the index is misleading since it masks the true state of shipping from Asia as we begin to dive into 2021.
Peter Tirschwell recently characterized today’s reality as “the global deceleration of container flows”, and boy is he right. Therefore, it is essential that we really understand that we are paying for the right to sit still and accumulate surcharge after surcharge (and delay after delay) in our supply chains.
Chart of the Issue:
Please note our best estimates for the true cost of shipping from greater Asia below:
Shap Fact of the Issue:
US real domestic product (GDP) rose 33.1% in the third quarter of 2020 after declining 31.4% in the second quarter.
The leadership and staff of Shapiro understand the personal and business anxiety each of you is experiencing. We want nothing but safety today and a return to normalcy tomorrow for you and your families. Please reach out to us if you have any questions—or if we can assist you in any way.
Up Next: Transpacific Imports and Port Congestion Woes
Supply Chain Reactions
A Condensed Update For American Shippers
Issue Date: December 2, 2020
Quote of the Issue:
“Think like a queen. A queen is not afraid to fail. Failure is another steppingstone to greatness.”
– Oprah Winfrey
US Trucking Landscape: Ready to Mobilize for Vaccine Transportation
ShapLight Focus: The domestic trucking industry employs nearly 3.5M Americans
- In coordination with Operation Warp Speed, the US Department of Transportation (DOT) has announced that it has taken all necessary regulatory measures for COVID vaccine transportation
- DAT reports that there are 4.5 FCL loads available per truck, equaling the 2020 high for this measure of trucking demand
- Despite the demand uptick and a modest 2.5% increase in fuel, nationwide trucking rates have been remarkably stable at $2.45 per mile; the industry anticipates upward pressure on rates in the coming weeks
- In November, inbound and outbound cargo volumes at Chicago rail complexes reached 52-week highs
- Los Angeles/Long Beach (LA/LB) terminals have been continuously crippled by port congestion, which has negatively affected port dwell times, trucker waiting time, chassis availability, local warehouse space, and the ability to return empty equipment reliably; the industry is witnessing two to three week wait times to get cargo on the rail from Southern California
US Congress: Slow to Renew Crucial Trade Programs
ShapLight Focus: The Generalized System of Preferences (GSP) program saves US importers and consumers over $1B in reduced duties annually
- Established by the Trade Act of 1974, the GSP is the largest and oldest US trade preference program; it is considered highly unlikely that Congress will renew GSP in 2020, however, a 2021 renewal is highly probable with importers almost certainly eligible for retroactively refunded duties
- In keeping with the American Manufacturing Competitive Act of 2016 (AMCA), the Miscellaneous Tariff Bill (MTB) – scheduled to expire on December 31st – is a law that temporarily reduces or suspends import duties on many products; though the US International Trade Commission (USITC) has vetted importer petitions, it appears that Congress is also unlikely to act on the MTB renewal before 2021, which will result in higher tariffs for importers of eligible products
- The Environmental Protection Agency (EPA) has greatly increased their scrutiny and examination rates of US imports across the country due to an increase in fraudulent product claims, as well as a rise in the importation of chemical products connected with COVID-19
- The Federal Maritime Commission (FMC) issued a supplemental order expanding the scope of Fact Finding No 29 (FF 29) into carriers’ detention and demurrage practices; the commission is closely evaluating a surge of complaints filed by shippers related to charges and penalties imposed during unprecedented congestion at US ports
Airline Industry Loses More Money in 2020 than any Year in History
- Air cargo generated 36% of total airline revenues in 2020, after yielding a mere 12% in 2019
- Total global airfreight volume is trending to be down 11.6% in 2020 vs. 2019; however total cargo revenues are up 15% year-over-year due to a 24% overall capacity diminishment and a steep 45% reduction in passenger belly space
- The airline industry continues to prepare for a truly global vaccine distribution; all major carriers have established task forces and project teams to evaluate the potential supply chain realities and to best prepare for efficient cold chain deliveries
- The International Air Transport Association (IATA) has predicted that the 2021 airfreight market will return to 2019’s volumes – over 61M tons – while setting a revenue record of $140B; the prediction is based on a continued cargo capacity crunch and an expected increase in time and temperature-sensitive shipping
- Cargo operations at Los Angeles Airport (LAX) are so congested that Air China has canceled all LAX bound flights until December 10th
Please note the following three-month airfreight rate trend chart:
Ocean Freight Import Rate Trend Charts
Ocean Import FAK Rates to US West Coast (per 40’):
Ocean Import Rates to US East Coast (per 40’):
Transpacific Forward Rate Projections (per 40′):
Our Expert Shapinion
Hurry Up, Pay More, Wait, Wait Again,
Pay More, Wait Again, Pay More, Repeat
-A Recipe for Very Angry Importers from Asia
There are moments in our industry where truth is actually stranger than fiction. And yes, sometimes you really do have to laugh to keep from crying. We are currently experiencing a true recipe for tears of rage for importers from Asia.
Basic Ingredients:
A steamship industry witnessing bountiful demand while fearing scrutiny from China’s Ministry of Transportation and the United States Federal Maritime Commission (FMC).
How Ocean Carriers are Cooking Importers in 2020:
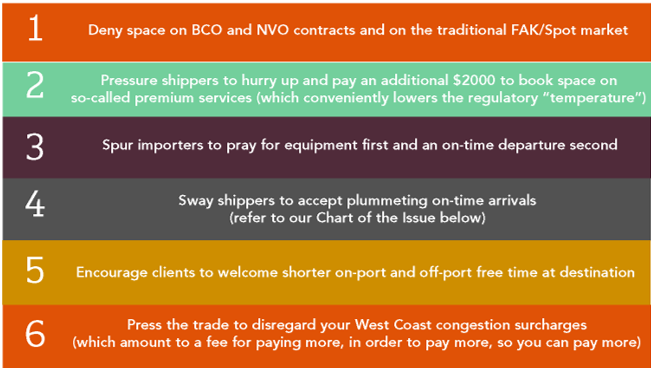
How Ocean Carriers are Cooking Importers in 2020:
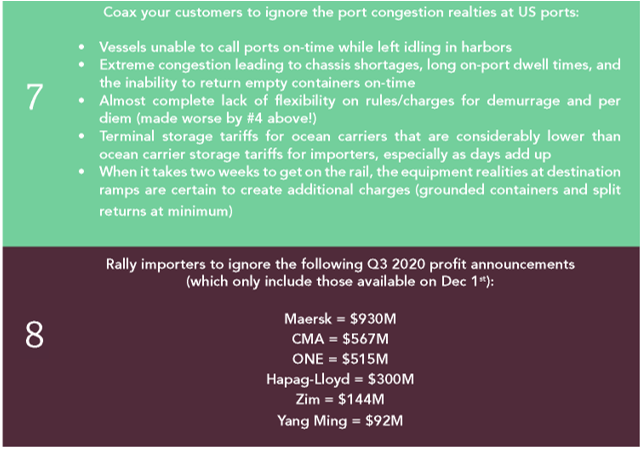
Ensure that your importer is paying $2000 or more extra per container to enjoy the least reliable transit times in a generation, only to offload at miserably congested terminals – some carrier owned – to face demurrage and per diem charges almost entirely outside the shippers’ control.
Also, be certain these storage charges are exacerbated by reduced free time from those same carriers, who happen to mark-up terminal charges incrementally for each day free time expires.
Finally, make certain that the record-breaking financial results for the ocean carriers are in the importers’ faces just as their storage invoices pile-up, well before receiving the critical merchandise they need for their own livelihood and survival.
Chart of the Issue:
Shap Fact of the Issue:
In 2019, 170 million Chinese tourists spent an estimated $220B abroad. With COVID travel restrictions and quarantine protocols in China, this $220B is a big part of China’s domestic growth plans for 2020 and 2021.
The leadership and staff of Shapiro understand the personal and business anxiety each of you is experiencing. We want nothing but safety today and a return to normalcy tomorrow for you and your families. Please reach out to us if you have any questions—or if we can assist you in any way.
Up Next: Transpacific Imports and Port Congestion Woes
Supply Chain Reactions
A Condensed Update For American Shippers
Issue Date: November 4, 2020
Quote of the Issue:
“Every storm runs out of rain.”
– Maya Angelou
US Trucking Landscape: Truck Driver Shortage in Spotlight during Surge
ShapLight Focus: Women comprise only 6% of the current truck driving labor force
- According to the American Transportation Research Institute, the top trucking industry concerns for 2021 and beyond include – (1) Driver shortages; (2) Driver retention and compensation; and (3) Compliance, safety, and accountability
- An estimated 40,000 new commercial drivers have not been able to obtain their learner’s permits and/or drivers licenses during COVID due to widespread DMV closures and shuttered training facilities; new licenses are down almost 40% in 2020 compared to 2019 YTD
- In October, 17% fewer trucks were available for spot moves, while spot loads rose over 122%; recent data reveals van spot rates were also up 33% YOY
- FTL rates per mile have remained stable after setting a record in early October; rates have dipped nearly 3 cents per mile to $2.41
- DAT reports that load postings per available truck now sit at a 4:1 ratio nationwide; however, the ratio remains over 5:1 in port cities as they work through tremendously high import surges
- Maersk and other ocean carriers have announced that chassis dwell times are now over seven days for Los Angeles/Long Beach (LA/LB); the crippling congestion for Southern California shows no signs of abatement, with total delays from port to rail averaging over two weeks at present
Government Pork: Trump Attempts to Trump Thailand with GSP
ShapLight Focus: Last week, President Trump revealed that nearly 240 HTS numbers on products from Thailand are scheduled to be removed from the Generalized System of Preferences (GSP) eligibility status in retaliation for Thailand’s continued lack of market access for US pork
- A US-based industry group wrote to the heads of the Senate Finance and House Ways and Means committees in an attempt to argue in favor of GSP being dramatically re-written to protect domestic interests; currently, the GSP program is set to expire at the end of this year (effective 12/31/20)
- The number of ongoing Section 301 litigation cases concerning Lists 3 and 4a tariffs has reached more than 3,500 filers and involves millions of entries
- The US Trade Representative (USTR) has initiated Vietnam Section 301 investigations
- President Trump has extended the Caribbean Basin Trade Partnership Act (CBTPA) through September 30, 2030; this trade preference program is unique in that it requires the use of US-manufactured yarns or fabrics in any finished apparel or goods in order to be eligible for benefits
Airfreight: How Will We Distribute a Vaccine Globally?
ShapLight Focus: Over 50% of air cargo capacity is booked on passenger-aircrafts not currently in service
- The industry has already expressed extreme concerns related to future global vaccine distribution; one of which being air capacity is already inadequate for current cargo demand, especially in cold chain
- Look out world – Apple’s newly released 5G enabled iPhone 12 and iPhone 12 mini are set to dominate outbound Chinese air supply in the coming weeks
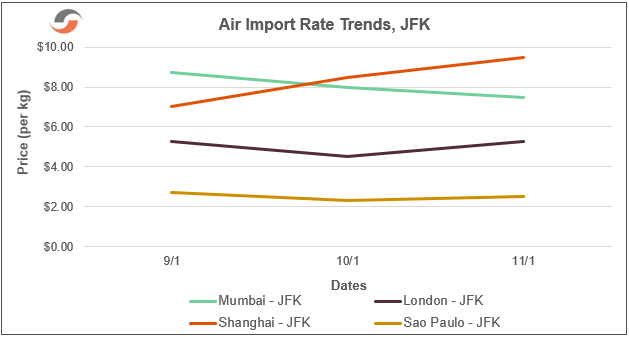
- In Hong Kong, Shenzhen, and Shanghai, 3-4-day shipping backlogs are the current normal; airfreight rates to the US from these origins are expected to eclipse $9/kg, and could easily go above $10/kg
- Although US air passenger traffic is down 64% from 2019, it was able to increase 6% last month (October 2020)
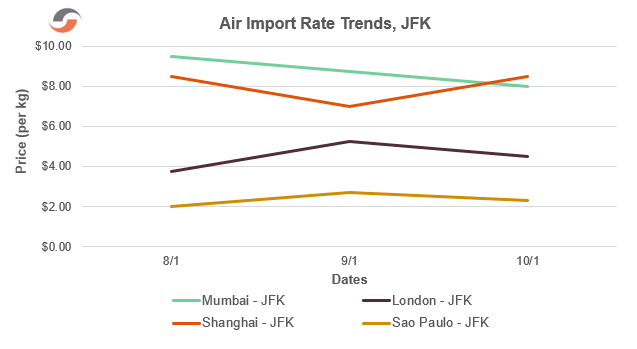
Please note the following three-month airfreight rate trend chart:
Ocean Freight: Imports from Asia Up Over 90% Since March
ShapLight Focus: This November, the LA/LB, NY/NJ, Savannah, and Miami/Port Everglades terminals are all on pace to surpass their 52-week highs in volumes
- More than 20% of the global fleet sat idle in May, however that ratio has shrunken to a microscopic 1.5%, thereby limiting the ocean carriers’ ability to adjust to future demand spikes
- A recent survey indicated that equipment shortages, port congestion, and chassis shortages are more expensive and disruptive to American importers than the high cost of ocean freight
- In September—October, the average VLSFO price was $335 per ton; Bunker Adjustment Fuel (BAF) levels should be quite close to current levels on January 1st, barring any huge spikes in November
- Since September 4th, the weekly Shanghai Containerized Freight Index (SCFI) has been within $100 for both the West and the East Coast markets
- During the months of August and September, 6 of the 7 largest global steamship lines rolled more than 20% of bookings – which is believed to have established a new record
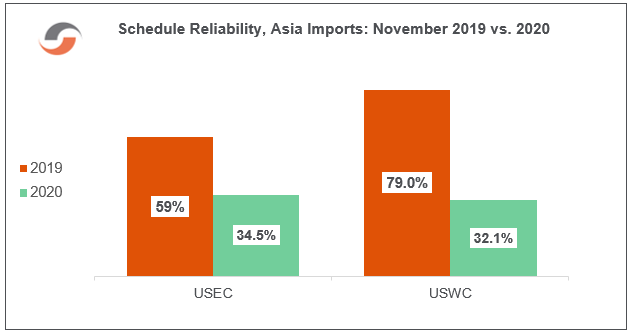
- Schedule integrity/on-time performance for the steamship industry dipped below 50% on cargo bound from Asia to either of the US coasts (USWC and USEC)
Ocean Freight Import Rate Trend Charts
Ocean Freight – Chart of the Issue:
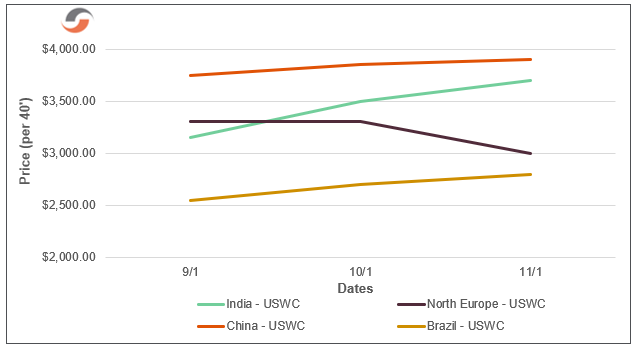
Ocean Import Rates to US West Coast (per 40’):
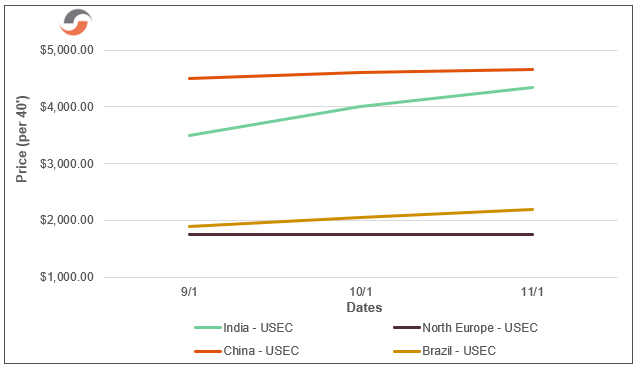
Ocean Import Rates to US East Coast (per 40’):
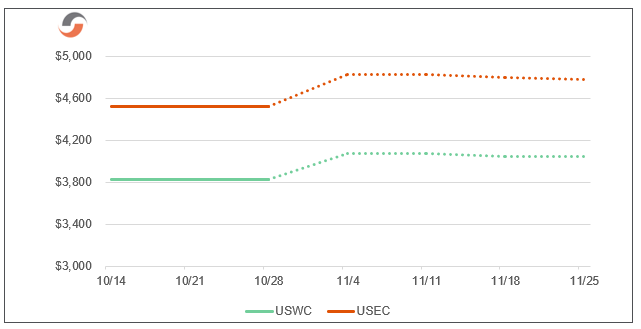
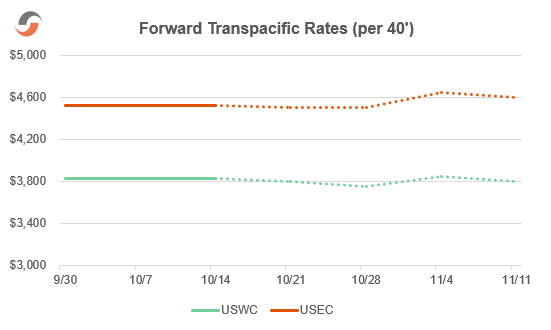
Transpacific Forward Rate Projections (per 40′):
Our Expert Shapinion
Fill-in-the-Blank-Sailings: How the %$#@ do I Budget in %$#@ 2021
Many of us have a calendar year budget, and we are being asked two very difficult questions right now:
- How could you miss your 2020 ocean freight projections by a mile?
- What can we expect for ocean freight spending in 2021?
If you happen to be a diligent follower of Shapiro’s publications and webinars, you might already have plenty to say about #1; however, it’s also likely that you have found #2 to be a real doozy.
Let’s start with a look at bigger picture threats to your supply chain efficiency – these factors may not directly affect ocean freight costs, but they will slow your cargo and potentially create damaging and budget-thumping indirect costs…
Bigger Picture Uncertainties:
- COVID’s global rebound and potential shutdowns
- American political and social unrest
- Cyberattacks
- Logistical realities of a global vaccine distribution
- On-going equipment shortages, port congestion, and chassis shortages
Please note that it is not our intention to demoralize any readers here – instead, it is crucial for all of us to build contingency plans and budget for them in 2021. As it stands today, the unprecedented events seen in 2020 are set to carry into at least half of the upcoming year.
With that in mind, here’s a quick look at the demand side of the ocean freight equation…
Ocean Import Demand Factors:
- Consumer spending in the US has radically shifted from services to goods because of the pandemic
- Domestic spending is up more than 11% on durable goods in 2020 vs. 2019; this marks the largest single-year increase on record
- Strong and continuous demand for shipments containing Personal Protective Equipment (PPE)
- Potential government stimulus plans – what should consumers expect?
- Next year’s inventory levels are being managed and evaluated differently than they were in 2020
Although we are enduring the highest unemployment rate in a generation, pundits have already forecasted 2021 GDP to shrink by 3.5% in the US. On the flip side, the US savings rate has reached well over 10% for the first time in 20 years (this may be a good thing for families, but it lowers consumption). However, another huge question remains – how long can a spike in durable goods spending last? After all, purchases of home appliances, home furnishings, and exercise equipment tend to last a long time and therefore are not likely to represent the foundation for continued spikes in demand.
Now, it is time to shift over to the ocean freight supply side…
Ocean Import Supply Notes:
- As the steamship industry experiences a period of reinvention, it’s become clear that capacity discipline is here to stay amongst the carriers
- Current alliance structures have proven agility through the routine deployment of blank sailings
- Presently, the Global Idle Fleet stands at 1.5% of total potential capacity; this has resulted in the smallest reading of this metric in over a decade
- New vessel orders/manufacturing are modest at best in the foreseeable future
- Moving ahead, the outlook on new vessel building is complicated by the uncertainties of carbon taxes/regulations
Now that we have outlined some of the key pieces of the 2021 transpacific ocean freight puzzle, it is time to offer an indication of future rate levels…
Best Guesses for Transpacific Ocean Imports in 2021 (Current Speculations):
- Contract levels from Asia Base Ports to USEC – $3100 to $3400 per 40’ HC
- Contract levels from Asia Base Ports to USWC – $2200 to $2400 per 40’ HC
- Average spot rate costs – $500 higher than the above contract rate levels
- Chassis and free time negotiations will be tremendously amplified
Today, the spot market sits well over $2000 higher per container than contract rates. At the same time, a very large population of importers holding contracts have agreed to general rate increases (GRIs) and/or have moved some of their cargo to premium services. We see little evidence that the carriers will have an incentive to slash average net rates for contracts come next April and May. However, we believe that supply discipline will be the most significant factor when it comes time to guesstimate 2021 ocean freight levels.
While the demand picture is shaky at best for the upcoming year, our consensus is that we are headed for the largest contract rate “correction” since 1997. Should demand ebb, we believe that there could very well be a few months of solid bargain hunting awaiting us on the 2021 spot market horizon.
Shap Fact of the Issue:
The US household savings rate – the saved share of net disposable income – skyrocketed to 34% in April and remains at 14% today. Historically, the rate has been below 7% in the US, which is well outside the top 10 countries worldwide.
The leadership and staff of Shapiro understand the personal and business anxiety each of you is experiencing. We want nothing but safety today and a return to normalcy tomorrow for you and your families. Please reach out to us if you have any questions—or if we can assist you in any way.
Up Next: US Trucking Assembles for Vaccine Transportation
Supply Chain Reactions
A Condensed Update For American Shippers
Issue Date: October 14, 2020
Quote of the Issue:
“There’s something to be said for sitting still and letting things clear, the way morning fog burns off the lake.”
– George Witte
FTL Trucking Landscape: Record Rates per Mile
ShapLight Focus: In October, FTL trucking rates hit a national average of $2.44 per mile, the highest rate on record and 153% higher than May 2020
- The drayage industry is reeling as port turn times increase, chassis shortages abound, and empty container dislocations diminish driver productivity and profits; the situation is expected to deteriorate further as US port volumes ride the crest of this prolonged peak
- Los Angeles/Long Beach (LA/LB) has reported a 30% increase in on-terminal dwell times, in addition to witnessing off-terminal chassis turn times reach 8 days; this is a recipe for congestion chaos and inevitable delays
- Estimates show that 80% more trucking volumes are moving on spot rates versus contract rates in 2020 compared to 2019; not only has demand been historically erratic due to COVID, but the trucking supply is also out of sync on previously established routes
- Until August, spot rates in 2020 had been below contract rates; at present, they are .15 per mile higher than contract rates
- Diesel fuel prices have been remarkably stable, with costs within a nickel for the last four months; the current average cost per gallon sits at $2.38
- DAT reports that load postings per available truck now sit at a five to one (5:1) ratio, marking the highest level since June 2018; this is a broad indication that demand is out-stripping supply and price increases may be looming
The Gov Corner: Was Section 301 Legal?
ShapLight Focus: Several lawsuits were filed with the US Court of International Trade (CIT) targeting the legality of Lists 3 and 4A for Section 301 tariffs on Chinese goods
- If successful, these lawsuits could result in the refund of all Section 301 tariffs levied on List 3 and 4A goods over the past two (2) years and up until the case is resolved, regardless of whether an exclusion was previously available or filed by an importer
- It has been recommended that importers file their own independent lawsuits to ensure eligibility for any refunds that may arise due to the CIT lawsuit
- The statute of limitations is two (2) years from the date of the cause of action; there is an argument that the applicable date is the date the duties were paid (which means the deadline becomes a rolling timeline)
- As a general matter, CBP uses the liquidation process for the issuance of duty refunds; in addition to filing suit with the CIT, it may be wise for importers to further protect their interests by either requesting liquidation be suspended or protesting the liquidation of entries
Airfreight Turbulence: Spiking Demand with Uneven Supply
ShapLight Focus: Average air rates remained above $8 per kg from India and returned above $8 per kg from China to the US
- Globally, airlines are struggling with a lack of passenger demand, which is negatively affecting available cargo capacity supply
- India air rates have remained high, mostly as a result of the tremendous equipment shortages and delays in the ocean freight supply chain; the resulting cargo back-log is expected to persist throughout 2020
- Chinese airfreight supply, already under pressure from continued personal protective equipment (PPE) shipping, is expected to come at a premium as US retailers look to ship holiday goods much earlier than past years; in particular, shipments of new-era smartphones and gaming consoles are expected to dominate air shipping from China
- Transportation Security Administration (TSA) reports that US passenger traffic remains almost 70% lower in October 2020 than it was in October 2019
- All eyes are on the overall financial health of the airline industry; even as cargo demand spikes, airlines are forced to seek government subsidies and assistance to help them recover from massive losses in passenger revenue
Please note the following three-month airfreight rate trend chart:
Ocean Carriers: Full Steam Ahead on Profits!
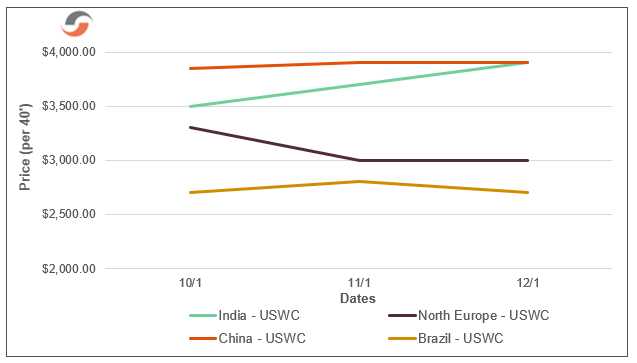
ShapLight Focus: The top 10 global ocean carriers reported an average Q2 operating margin of 8.5% after achieving 2.6% in Q1 and 1.9% for all of 2019; this is the best result for the sector since 2010
- Industry experts estimate that a mind-blowing 10% of China’s ocean exports are now moving on “premium” services, which cost between $300 and $1200 extra per container; the industry average for “guaranteed” or “premium” services is $750 per 40’
- For the first time in 5 years, every major global steamship line was profitable in Q2 2020 (including HMM!); with ocean rates hitting record levels in Q3, there is no reason to expect diminished results when final financials are announced
- The steamship industry suffered its fourth major cyber-attack as CMA fought to recover from a ransomware assault on September 28; Maersk (2017), COSCO (2018), and MSC (April 2020) preceded CMA in fighting major system breaches
- The shipping trade has expressed serious concerns about carrier cyber-security overall; the mix of ships that the lines either own or charter for long periods of time – and share within alliances – complicates any concept of having standardized cybersecurity strategies fleetwide
- Although CMA announced a full recovery of online services after two weeks of manual bookings, they requested a 60-day grace period with the FMC to straighten out rate filings and paperwork
- Maersk will phase out its Safmarine and Damco brands by the end of this year, targeting a simplification of the customer interface; under the reorganization, the Safmarine brand will be integrated into Maersk, while Damco’s air and LCL business will be combined with Maersk’s logistics and services products
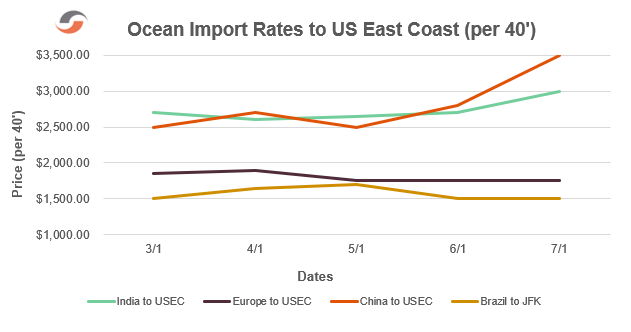
Ocean Freight Import Rate Trend Charts
Ocean Import Rates to US West Coast (per 40’):
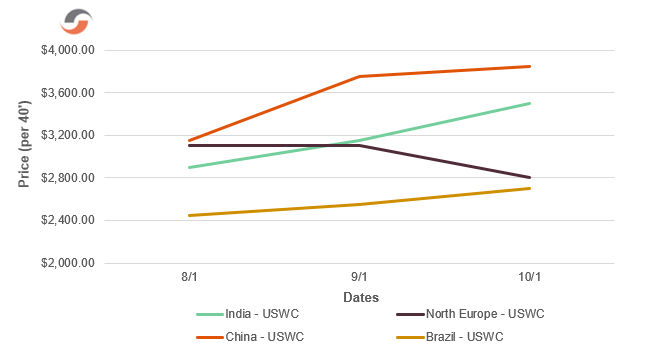
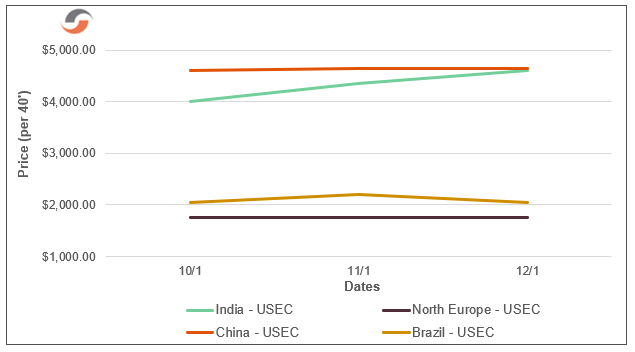
Ocean Import Rates to US East Coast (per 40’):
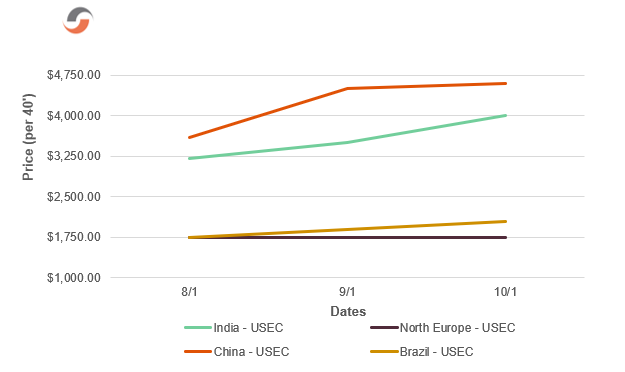
Ocean Freight – Chart of the Issue:
Our Expert Shapinion
Demanding an Explanation for September’s Transpacific Surge
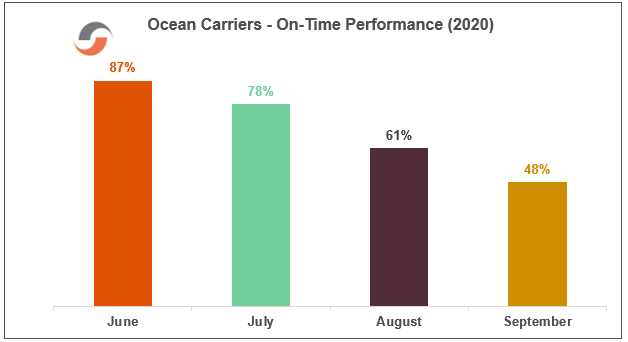
At this point, we have all read a lot about the supply side in 2020. We have watched ocean carriers repeatedly blank sailings, idle ships, and deliberately launch extra loaders to move backlogged and rolled cargoes from Asia. In September, we welcomed a much-needed feeling of hope as weekly capacity from China reached a record-breaking 530,000 TEUs. Then, our frustrations returned as the Golden Week slow-down provoked carriers to blank nearly 20% of capacity for the week starting October 5 and a total of 130,000 TEUs for the month of October. However, the staggering year-over-year increases in imports – 198% to the US East Coast and 294% to the US West Coast — cannot be explained by supply alone.
Please have a look at the following motley chart of demand increases from 2019 to 2020:
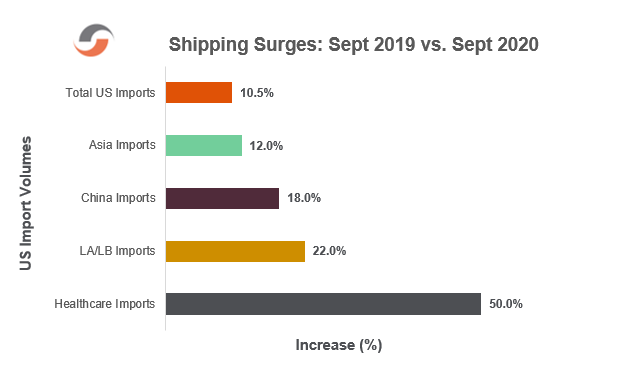
Fueled by demand increases since June, the Transpacific peak season continues to chug along and shows little evidence of slowing down, despite very mixed macroeconomic and COVID news in the US and internationally. Let’s take a closer look at the industry verticals with strong demand:
- Personal Protective Equipment (PPE) – roughly 10% of total current volumes
- Healthcare shipping – up 50% vs. 2019
- Home furnishings and household appliances – up more than 50%
- Consumer staples – up 29.1% and still rising
- Consumer discretionary spending (including electronics and gifts)— up 25%
- Industrial goods – up 13.7%
At the end of the day, there are three main fuels for the demand surge:
- The COVID effect
- E-commerce growth and emphasis
- An untraditional front-loaded shipping reality for the 2020 holiday season
It now seems obvious that the experience of being short on PPE and healthcare products was an intolerable reality for Americans, the healthcare industry, and the suppliers of those products. Additionally, many companies have begun to market and sell these types of products as a means of drawing consumers to their stores (virtual or not); this demand remains strong.
But, the most profound effect of COVID (and US social unrest more broadly) is reflected in the staggering demand for home furnishings and household appliances. Spurred in part by historically low interest rates and driven to the safety of the suburbs, Americans are buying and selling real estate and furnishing those homes. And, for those staying home, they simply cannot bear the sight of that sofa for one more day (and they have that refi money to spend). It’s important to note one more factor – shipments of home furnishings and appliances are bulky and require a lot of containers for movement. So, the question is, how long can this demand persist?
E-commerce supply chains require faster transits and more inventory to succeed. As we watch American retailers re-invent themselves, we see more and more importers emphasizing the USWC and especially LA/LB terminals – which now handle 54% of imports from Asia and an even greater percentage from China. While this segment is here to stay and will continue to grow, one imagines that once inventory levels reach critical mass, the emphasis on the USWC will lessen at least slightly. This leads us to the holiday shipping season for 2020…
Retailers expect consumers to do their holiday shopping earlier than usual for both in-person and online purchases. The argument is that shopping early helps people avoid crowds, courier surcharges and delays, and potential out-of-stock realities. Also, there is some evidence that people will want to spoil loved ones a bit after avoiding vacation and other travel expenses during COVID. With October replacing Black Friday (late November), we could be seeing a more temporary demand surge today, which basically amounts to front-loading the typical holiday peak.
On October 1st, we celebrated the first month without a general rate increase (GRI) in five months. We have endured 8 GRI increases since May 1st; each one has averaged $329/FEU (as depicted in the Ocean Freight – Chart of the Issue). Surely, this MUST be evidence of a market slow-down, right? Not so fast. When you look closely at what ocean carriers are saying, they seem more worried about regulatory scrutiny from China’s MOT and the US FMC than modest rate gains for now.
Considering October’s blank sailings and the continued demand strength across so many industry verticals, in e-commerce, and the upcoming holiday season, it looks like we need to prepare for a peak season that maintains strength through the remainder of 2020.
Shap Fact of the Issue:
A San Francisco company, formerly called Pizza to the Polls and designed to deliver ‘za to people standing in line to vote, has profoundly pivoted and is now called Power to the Polls. The new organization has recruited 450,000 young people (and counting) to replace traditional American pollsters – 70% of whom are retirees – who will be sitting out the 2020 election amid serious COVID-19 health concerns.
The leadership and staff of Shapiro understand the personal and business anxiety each of you is experiencing. We want nothing but safety today and a return to normalcy tomorrow for you and your families. Please reach out to us if you have any questions—or if we can assist you in any way.
Up Next: Truck Driver Shortage Lacks a Woman’s Touch
Supply Chain Reactions
A Condensed Update For American Shippers
Issue Date: July 14, 2020
Quote of the Issue:
“A winner is a dreamer who never gives up.”
– Nelson Mandela
Government Corner: WHO Cares?
ShapLight Focus: The U.S. Trade Representative has (USTR) announced additional 25% duties on $1.3B in French luxury goods (including make-up and handbags) to take effect in January 2021 should France and the US not agree on French digital services taxes on US goods
- President Trump gave formal notice of US withdrawal from the World Health Organization (WHO); Lamar Alexander, chairman of the Health, Education, Labor, and Pensions Committee, said that the withdrawal could “interfere with clinical trials that are essential to the development of vaccines” and “could make it harder to work with other countries to stop viruses before they get to the United States”
- As part of the $4 billion Operation Warp Speed project, the US government will pay $1.6 billion to a Maryland-based vaccine company, named Novavax, to produce a COVID-19 vaccine by January 2021
- 1058 federal Customs employees have tested positive for COVID-19
- Since March, the FDA has authorized 166 virus tests under emergency use authorizations
- The FDA and EPA have mandated that 193 unapproved products claiming to diagnose, treat, prevent, or cure COVID-19 be removed from online marketplaces
- APHIS implementation in ACE (originally scheduled for August 3, 2020) has been delayed and will now be implemented in January 2021
Economics 101: Welcome to the Roller Coaster
ShapLight Focus: It is believed that at least 3 million of the 14 million US jobs lost during COVID are permanently lost
- The US Labor Department announced an encouraging gain of 4.8 million jobs for June, although new unemployment claims also surged by the month’s end
- US automobile sales spiked by 8% in June vs. May while still being 24% behind 2019
- New mortgage applications are up 15% in the US while 10% of existing mortgage holders failed to make their last payment
- 110 companies, including Hertz and JC Penney, have declared bankruptcy, naming COVID as the primary cause
- Same-store US retail sales have been steadily improving since March, but may have leveled off at about 7% behind last year
Global Round-Up: China and Vietnam Swimming Upstream
ShapLight Focus: China’s Q2 GDP is expected to rise by 3% after their historic 7% plunge in Q1 2020
- Job losses in the EU have been 10 times worse than the first three months of the 2008 global financial crisis, making full economic recovery unlikely until 2022 at the soonest
- Brazil’s broad-based economic activity index has fallen by 10% since March, with Peru and Colombia experiencing nearly 40% declines over the same period
- While US stocks have gained in recent months, the MSCI’s world index of stocks is still down 6% since the Wuhan lockdown in January
- Despite COVID, Vietnam is expected to grow by 4-5% in 2020 and 7-8% in 2021
- Goldman Sachs estimates a 45% overall economic decline in India for April to June
US Transportation Infrastructure Update
ShapLight Focus: More than half a million truckers are being supported in some fashion by PPP loans; this number represents over 30% of the trucking workforce
- Total ocean import volumes at US ports are forecast to decline 14.1% in July and 13.3% in August when compared to 2019’s totals
- After declining 8.6% in Q1, North American rail volumes declined again in Q2, losing 12.6% YOY
- 2020 US construction equipment operating hours levels are now on par with 2019
- Truckload rates were up 12.3% from May to June, but they still trail 2019 by 5%
- TSA passenger throughput, while steadily rising, is still just 74% of last year’s levels
- On average, trucking contracts are 20% shorter in duration, while offering 20% fewer covered lanes; this reflects the extreme uncertainty of forward demand for trucking
- Due to soft demand, United Airlines has reduced their planned August increase in flights and coverage to 35% of normal levels after announcing a target of 40% of 2019 capacity
Shapiro’s Import Freight Report
Airfreight:
ShapLight Focus: Air rates from India to US are now regularly 100% higher than rates from China
Ocean Freight:
ShapLight Focus: All told, ocean import rates are up over 18% since March and 28% compared to 2019, despite the fact that total volumes have decreased by more than 15%
Transpacific Focus:
ShapLight Focus: WC rates are almost 60% higher today than exactly a year ago, while EC rates are up a “mere” 20%
In a World of Bad News, a Few Silver Linings
ShapLight Focus: On Monday, New York City announced zero COVID deaths in a 24-hour period for the first time since March
- 8th graders at Waldorf School in Santa Fe had saved all year for their dream rafting trip, which had to be canceled amid COVID concerns; when they heard of the extremely high infection rates inside Navajo Nation, the students spent every penny of their fund on essential supplies and delivered them to the Navajo people
- Guess what? When a rafting company read the news about those students from Santa Fe, they pledged an all-expenses-paid rafting trip for the group after the pandemic!
- Olivia Dru Cares, a non-profit launched by a seven-year-old, has provided over 1000 masks to help protect Chicago’s homeless during the crisis
- Alegba Jahyile, a Haitian raised in New York, began meeting bandmates at the boathouse in Brooklyn’s Prospect Park just to get out of the house and play a little music; the jam sessions have turned into nightly (socially distanced) concerts for Bro
Shap Fact of the Issue:
The National Oceanic and Atmospheric Administration has noted that multiple climate factors indicate “above normal” activity for the Atlantic hurricane season, which runs from June 1 through November 30.
The leadership and staff of Shapiro understand the personal and business anxiety each of you is experiencing. We want nothing but safety today and a return to normalcy tomorrow for you and your families. Please reach out to us if you have any questions—or if we can assist you in any way.
Up Next: FTL Trucking Rates Continue to Ramp Up
Supply Chain Reactions
A Condensed Update For American Shippers
Issue Date: June 25, 2020
Quote of the Issue:
“Don’t ever make decisions based on fear. Make decisions based on hope and possibility”
– Michelle Obama
US Alcohol Sales: Wine and Spirits Proving to be “Essential” for Americans
ShapLight Focus: US alcohol sales have been 20% higher or more year-over-year for 8 straight weeks with wine sales topping a 30% increase for 2020
- The USDA’s Farmers to Families Food Box Program has delivered more than 20 million food boxes in support of American farmers and families
- New Zealand, Australia, Singapore, Canada, and Chile have committed to removing existing trade barriers for 120 types of medical supplies to improve cargo flows
- US casual dining coverage has reached 50% with 87% of restaurants open but at diminished capacity
- The US Department of Defense signed a $100M agreement with the US International Development Finance Corporation to subsidize growth in US medical product manufacturing capabilities
- The Small Business Administration is accepting Economic Injury Disaster Loan applications from qualified small businesses and US agricultural enterprises
- As countries grapple with recent failures in the global medical supply chain, the WTO has stressed that importing and foreign sourcing are not the problem; it is the dependence on single suppliers and origins that create the failures
Government Corner: The US Threatens a Second Trade War
ShapLight, Focus: The number of positive COVID tests in CBP now nears 700
- The US has threatened new or increased tariffs on $3.1 billion of European exports, raising some duties to 100% as soon as mid-August; the focus will be primarily on luxury food and wines and spirits from Germany, France, Spain, and the UK; the threat is just the latest chapter of a now 15-year-old World Trade Organization (WTO) battle over subsidies to Airbus by the EU and to Boeing by the US
- The US Environmental Protection Agency (EPA) ordered eCommerce platforms, such as Amazon and eBay, to immediately halt the sale of a range of “pesticide” products, such as “epidemic prevention bleach” and “coronavirus disinfectant”
- Starting July 1st, the USMCA will officially replace NAFTA
- Fish and Wildlife will become mandatory in ACE starting July 6th; this covers 268 tariff codes that may have augmented filing requirements
- The USDA delivered an additional $288 million to the Coronavirus Financial Assistance Program (CFAP); CFAP payments to American farmers have reached over $1 billion
Despite Governmental Aid, Expectations are Bleak for GDP
ShapLight Focus: The global total of COVID-related financial aid for companies and workers has now topped $11 trillion
- The International Monetary Fund (IMF) downgraded their already gloomy outlooks for GDP in 2020; they are now predicting a decline of 5% globally, 8% for the US, and over 11% for the EU and UK
- Total unemployment benefit payments in the US reached almost $23 billion in May; this figure is more than 10 times May 2019 and is an all-time US record
- The Morgan Stanley Capital International’s world index of global stocks is now 7% down since January’s Wuhan lockdown
US Transportation Infrastructure
ShapLight Focus: As of June 12, transportation (excluding airlines) and warehousing firms have received 161,794 Payroll Protection Program loans with a total value of $16.4 billion; this represents less than 5% of the program’s total allocations
- The US DOT has begun funding the Infrastructure for Rebuilding America (INFRA) program; they recently announced that the Port of Houston will receive $79.4 million
- Industrial real estate experts are forecasting an increased demand for warehouse space topping 500 million square feet in the next two years due to the fact that e-commerce fulfillment requires three times the warehouse space of traditional warehousing; 500 million square feet is approximating 14,000 acres or the size of Manhattan
- The Cass Freight Index, a broad indicator of US trucking health, was down over 20% in May 2020 vs. 2019 for both total shipment volume and shipper trucking expenditures
- Trucking data for June, however, shows marked improvements in two key ratios; the loads per truck index is up 38%, and the avg rate per mile is up almost 10%
- Intermodal rail moves continue to be down 12-14% per week, and analysts believe the US rail slow-down will be more persistent than trucking due to the low cost of diesel fuel
- Bucking US trends, The Richmond, VA Marine Terminal has handled 24% more cargo volume in 2020; the growth is attributed to an increase in agricultural trans-loading and food distribution center demand
Shaprio’s Import Ocean Freight Report
India and Pakistan:
ShapLight Focus: US import rates from India sit at 81-84% compared to Asia, and Pakistan rates are just 62-65% on the same scale
- Ocean rates from India to the USEC have been remarkably stable during COVID with a spread of just 6% from high to low since March
- Similarly, ocean rates from Pakistan have shifted just 9% from high to low since February with June levels establishing the low
- Ocean rates to the USWC from both India and Pakistan have been much more volatile, with a 33% increase from India in the last month and a 15% increase from Pakistan over the last six weeks
Continental Europe and the Mediterranean:
ShapLight Focus: While WC and EC rates are currently within 15% for Asia, imports from Europe to the USWC are roughly 40% higher than USEC rates
- In 2019, import rates from Continental Europe varied just 6% from high to low; 2020 has been much more volatile, with a 16% variance from the top to the bottom of the market
- Current average 40’ rates from Northern Europe are $2000 to New York and $3300 to LA
- Rates from the Mediterranean have been gradually descending since March with a July GRI expected to be offset by lower BAF levels
- Current rate levels out of the Mediterranean are about 5-6% lower than Northern Europe’s numbers
Latin America:
ShapLight Focus: Despite our best efforts, there are times when our ShapLight research does not reveal a story; while COVID has wreaked havoc on origin trucking and port operations, the rate picture for Latin America (both coasts) to US (both coasts) has been remarkably flat for several months
- Typical ocean rates from West Coast Latin America: $1550/40’ to either coast
- Typical ocean rates from East Coast Latin America: $1700/40’ to USEC and $2400/40’ to USWC
Asia and Transpacific:
ShapLight, Fact of the Week: After rising $1077 in two weeks, the US West Coast (USWC) spot rates from Asia reached a ten-year high of $2755 per FEU
- While June demand still trails 2019 by over 10%, suppressed capacity (primarily in the form of 74 blank sailings in May and June) have allowed carriers to increase rates 184% to the West Coast and 128% to the East Coast since May
- Total US imports from Asia were down 18.3% in March, 1.7% in April, and 18.5% in May
- There is growing tension between BCOs and ocean carriers with the carriers claiming that importer forecasting is uneven and no-show bookings are at all-time highs; for their part BCOs believe that carriers are making excuses for the suppression of supply
- BAF charges will decrease on July 1, while actual reductions vary tremendously by ocean carrier; industry pundits estimate the average savings to be 4% per 40’ to the US East Coast (USEC)
- A whopping nine ocean carriers are now offering “premium” services with faster guaranteed transit times and greater space protection at markedly higher rates
- Despite a decline in blank sailings, the trade expects a GRI of between $200-$300/container on July 1 for both coasts and Chicago
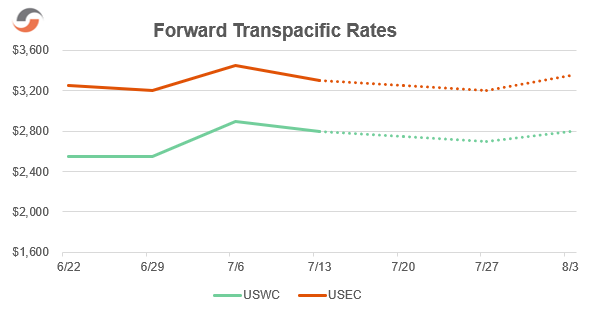
Please note Shapiro’s forecast for future rates on the Transpacific trade:
In a World of Bad News, a Few Silver Linings
ShapLight Focus: As New Yorkers celebrate their phased re-opening, fireworks complaints in the five boroughs have exploded by 40,000%; there have been 11,275 complaints in the first three weeks of June alone!
- US domestic flight searches online are down just over 40% in May-June after having been down 80-95% in March-April
- The IMF has forecasted global GDP growth of over 5% for 2021
- For June to date, $46.7 billion in US high-yield “junk bonds” have been sold, already the highest total in history
- The Senate voted to pass the Great American Outdoors Act, which frees $20 billion for repairs and maintenance of America’s national parks and public lands
- Netflix CEO Reed Hastings and his wife Patty Quillin are gifting $120 million to historically black colleges and universities with the goal of supporting 600 students over the next decade
Shap Fact of the Issue:
US home-buying activity is up 25% in May to June after having been down 21% in April.
The leadership and staff of Shapiro understand the personal and business anxiety each of you is experiencing. We want nothing but safety today and a return to normalcy tomorrow for you and your families. Please reach out to us if you have any questions—or if we can assist you in any way.
Up Next: USTR Announces Additional Duties on French Luxury Goods
After nearly 25 years, on July 1, 2020, the North American Free Trade Agreement (NAFTA) will be officially replaced by the US-Mexico-Canada Agreement (USMCA).
Now that the implementation of the USMCA has arrived, it is more important than ever to make sure you and your supply chain are ready for the changes. These modifications will include: New Customs regulations being issued prior to implementation (under 19 CFR 182); a new Special Program Indicator of “S” on your 7501; updates to general note 11 of the Harmonized Tariff Schedule of the United States (HTSUS); and more.
The Federal Register Notice for the Implementation of the Agreement Between the United States of America, the United Mexican States, and Canada (USMCA) Uniform Regulations Regarding Rules of Origin (85 FR 39690) was issued on 7/1/2020.
Prior to the publication of the final implementation instructions, CBP expected the trade community to read and review the language within the official agreement in order determine if your importations will qualify as an originating good under the USMCA. Here are links to the original documents should you wish to review them:
- US-Mexico-Canada Agreement Final Text
- Updated Interim Implementation Instructions (published June 30, 2020)
- Uniform Regulations for the USMCA’s Rules of Origin (Chapter 4) and Origin Procedures (Chapter 5) (published June 3, 2020)
CBP has launched an internal USMCA Coordination Center; this entity was created to ensure, organize, and guide the implementation of the USMCA for CBP and the trade community. As part of its preparation efforts, CBP has created a USMCA informational webpage on its site, where it will post relevant compliance guidance, announcements, points of contact, and/or FAQs. The International Trade Administration (ITA) has also created a webpage containing resources related to the USMCA, which is accessible to the public.
What Should You Expect to Change When USMCA Becomes Effective?
If you are you confused by the name of this agreement, then you are certainly not alone! Each of the 3 countries involved in this deal refers to it by a different name, which has caused a bit of confusion for people. The official names include:
- Canada – the Canada-United States-Mexico Agreement, or CUSMA
- Mexico – the Tratado entre México, Estados Unidos y Canadá, or T-MEC
- United States – the United States-Mexico-Canada-Agreement, or USMCA
Rules of Origin Forms
One of the biggest changes between NAFTA and the USMCA is that the USMCA does not require a specific certificate of origin form. Instead, the new agreement requires nine specific data elements, which can be presented in any format. The minimum data elements are as follows:
- Importer, Exporter, or Producer Certification of Origin: Provide a description of the product, including the 6-digit HTS classification code. The description should be sufficient to relate it to the good covered by the certification; and if the certification of origin covers a single shipment of a good, indicate the invoice number related to the exportation (if known). Indicate whether the certifier is the exporter, producer, or importer. If an importer is producing the certification, they must insist on doing their own origin analysis to be certain the goods qualify. Importers should look for an exporter or producer’s certification.
- Certifier: Provide the certifier’s name, title, address (including country), telephone number, and email address.
- Exporter: Provide the exporter’s name, address (including country), e-mail address, and telephone number (if different from the certifier). This information is not required if the producer is completing the certification of origin and does not know the identity of the exporter. The address of the exporter shall be the place of export of the good in a Party’s territory.
- Producer: Provide the producer’s name, address (including country), e-mail address, and telephone number (if different from the certifier or exporter); if there are multiple producers, state “Various” or provide a list of producers. A person who wishes for this information to remain confidential may indicate that it is “available upon request by the importing authorities”. The address of a producer shall be the place of production of the good in a Party’s territory.
- Importer: Provide the importer’s name, address, e-mail address, and telephone number (if known). The address of the importer shall be in a Party’s territory.
- Description and HTS Classification of the Good: This document is for advance informational and advisory purposes only. It is not final and is subject to further revision. It is not intended to have legal or binding effect. Any decisions a reader makes based on this draft document are made with the understanding that the information in this document is advisory only and may change. The reader is responsible for monitoring the CBP website to ensure awareness of the status of any revisions to this document.
- Origin Criteria: Specify the origin criteria under which the good qualifies, as set out in Article 4.2 (Originating Goods).
- Blanket Period: Include the period if the certification covers multiple shipments of identical goods for a specified period of up to 12 months, as set out in Article 5.2.
- Authorized Signature and Date: The certification of origin must be signed and dated by the certifier and must be accompanied by the following statement: “I certify that the goods described in this document qualify as originating and the information contained in this document is true and accurate. I assume responsibility for proving such representations and agree to maintain and present upon request or to make available during a verification visit, documentation necessary to support this certification.” Digital or electronic signatures will be accepted.
For additional information on these data elements, please refer to Chapter 5 (Origin Procedures), Article 5.2 (Claims for Preferential Tariff Treatment) and Annex 5-A (Minimum Data Elements) of the USMCA.
Another important change to note is that NAFTA Form 434 (Certificate of Origin) will not be accepted by U.S. Customs effective July 1. As of now, CBP has not announced plans for a transition period from Form 434 to a new form. However, to help avoid confusion, CBP Form 434 will no longer be accepted for claims of preferential treatment under the USMCA.
Even if the rule of origin for the good under USMCA is the same as it was under NAFTA, and all of USMCA’s required data elements are present on Form 434, the goods will still need to be recertified with the nine required elements (provided above) under USMCA. Unfortunately, CBP has yet to offer a version of the USMCA Certificate of Origin form. However, for those interested in viewing this information, the Canada Border Service Agency has provided a sample Certificate of Origin letter via its website.
To see if the rules of origin have changed, companies must research all HTS classifications for products that are exported or imported to/from Canada and Mexico. Why? Because it is important for companies to review this information for two reasons: to become proficient in qualifying their goods, and/or to determine if anything has changed. Although many classifications may remain unchanged, you must still go through the exercise to enable you to provide a certificate for your company that currently exports to Canada or Mexico, or a company with whom you do business. Plus, your business partners will surely ask for a new certification so they can qualify their own exports.
Using the Regional Value Content (RVC) Calculation Methods
For most goods, the agreement provides for two Regional Value Content (RVC) calculation methods. The below is a detailed breakdown of the math:
- Transaction Value Method: RVC = (TV – VNM)/TV x 100
- RVC: regional value content, expressed as a percentage
- TV: transaction value of the good, adjusted to exclude any costs incurred in the international shipment of the good
- VNM: value of non-originating materials, including materials of undetermined origin used by the producer in the production of the good
- Net Cost Method: RVC = (NC –VNM)/NC x 100
- RVC: regional value content, expressed as a percentage
- NC: net cost of the good
- VNM: value of non-originating materials including materials of undetermined origin used by the producer in the production of the good.
Additional Notes:
- Generally, the regional value content of the good must not be less than 60% under TVM, or not less than 50% if the NCM is used, but there are exceptions:
- Automotive Goods have their own special rules under Appendix 1.
- Textiles and Apparel items have their own special rules under Chapter 6 of the USMCA. These specifically cover a textile or apparel good classified in Chapters 50 through 60 or heading 9619, and textile or apparel goods of Chapters 61 through 63.
De Minimis Provision (Non-Textiles)
The USMCA has a 10% de minimis provision for most goods, including goods subject to RVC requirements, with certain exceptions for goods classified in Chapters 1 through 27, as well as some textile and apparel goods.
Under the de minimis rule, a good qualifies as an originating good if the value of all non-originating materials used in the production of the good, which do not undergo an applicable change in tariff classification set out in GN 11 (which is pending), is not more than 10% of either:
- The transaction value of the good adjusted to exclude any costs incurred in the international shipment of the good; or
- The total cost of the good; if the good is also subject to an RVC requirement, the value of de minimis materials is included in the total value of the non-originating materials
A good that is otherwise subject to an RVC requirement is not required to satisfy the condition if the value of all non-originating materials used in the production of the good is not more than 10% of the transaction value of the good, adjusted to exclude any costs incurred in the international shipment of the good, or the total cost of the good, provided that the good satisfies all other applicable requirements.
Major Shifts in Automotive Trade
There are major changes to automotive trade; the USMCA is expected to be increasing the RVC from 62.5% to 75% over 3 years. In addition to the product-specific rules of origin in the automotive appendix or other requirements in the automotive appendix, a passenger vehicle, light truck, or heavy truck is originating only if at least 70% of steel and aluminum that originates in North America.
Another marked change for the automotive industry includes prescribed wage rates for each territory. For information regarding wage rates, we recommend reviewing APPENDIX I – Automotive Rules of Origin and Procedures, which can be found on page 12 of the interim implementing instructions.
The USTR also published a Federal Register Notice regarding Alternative Staging Regimes for Automotive Imports (85 FRN 22238) on April 21, 2020.
Learning the US – M – C – A Takes a Village, People!
Did you get a headache at the mere thought of all the changes coming your way, such as requalifying all your goods? Join the club!
This information might feel a bit overwhelming at first, but it is important to remember that these implementing instructions have not yet been finalized by CBP. Although we highly recommend you gain an understanding of the upcoming changes now, we strongly encourage you to also monitor CBP’s website for updates on the above information.
Shapiro will follow this implementation and will update our customers when the regulations are published. Please reach out to [email protected] for assistance.
If you have additional questions, comments and concerns for CBP, you can also contact the Trade Agreements Division directly at (202) 945-7228, or via email, [email protected].
As of May 27, 2020, the United States Trade Representatives (USTR) has published 32 rounds of Section 301 exclusions covering Lists 1, 2, 3 and 4a products. The exclusions include more than 2,000 possible items that, if produced in Mainland China and imported into the United States, may be eligible for an exclusion from the additional Section 301 duties imposed on many finished goods.
- List 1 has seen 10 rounds granted to date. This list covers a variety of machinery goods from Chapters 84 and 85, a handful of automobile and aircraft parts of Chapters 87 and 88, and certain optical equipment from Chapter 90. These exclusions cover items entering the U.S. on or after July 6, 2018.
- Although List 2 only covers about half of the number of products as List 1, it has still seen 4 rounds of exclusions granted since its implementation. Unlike the first, it covers an assortment of products, such as plastic items of Chapter 39, glass rods of Heading 7002, metal items of Chapter 73 and 76, machinery of Chapters 84 and 85, automobile items of Chapters 86 and 87 and additional optical equipment of Chapter 90. These exclusions cover items entering the U.S. on or after August 23, 2018.
- While List 3 has had a shorter lifespan than its two predecessors, it has already had 14 rounds of exclusions granted due to the wide range of products affected by these additional duties. Thus far, exclusions have been given for items from 46 of the 96 total possible chapters; excluded products range from fish of Chapter 03 to furniture of Chapter 94. These exclusions cover items entering the U.S. on or after September 24, 2018.
- List 4a has had 4 rounds of exclusions to date. These exclusions cover a variety of medical items ranging from certain soaps, plastic laboratory items, rubber apparel and various textile garments. These exclusions cover the items entering the U.S. on or after September 1, 2019.
Do 301 Exclusions fit in your pantry?
Before you can begin utilizing a product exclusion, you must first determine if your item is a product specific exclusion for full HTS subheading. Similar to the Miscellaneous Tariff Bill (MTB) for duty reduction, product specific exclusions require that the HTS subheading meet the excluded HTS code provided by the U.S. Trade Representative (USTR), in addition to the specific description of the product. This means that if your item matches the HTS, but does not meet the description provided, you do not qualify for the exclusion.
Like most things in your pantry, Exclusions have a limited shelf-life!
Please be aware of the expiration dates for each list; they are not all the same!
- Each product excluded from Lists 1 and 2 only has a one-year shelf life from the date it was published in the Federal Register (FR).
- List 3 exclusions have been handled differently from the first and second lists. Instead of a full year, the USTR set an expiration date of August 7, 2020 for all List 3 exclusions. (That’s a lot of expiring ingredients come August…!)
- Similar to List 1 and 2, List 4a exclusions are set to expire one year from the date the additional duties were implemented. This means that List 4a exclusions are retroactive from September 1, 2019 and extends to September 1, 2020.
If you have imported items from List 1 on or after July 6, 2018, from List 2 on or after August 23, 2018, List 3 on or after September 24, 2018 or List 4a on or after September 1, 2019 that are eligible for an exclusion, then you are able to request a refund of the additional duties paid by submitting a post entry correction (post summary correction (PSC) or protest).
Be mindful that there are specific deadlines to file PSCs and protests; time of entry and time of liquidation dictate what type of post entry correction is required and whether or not it is able to be submitted at all.
Does the chef (you) have a say in the matter?
Of course, you do!
The USTR is asking the trade community at-large to submit comments on previously granted exclusions prior to their planned expiration date. They are seeking comments from importers and other interested parties to determine if the imposition of duties will result in severe economic harm.
Much like recipes, not every exclusion will have the same result. All product exclusions are evaluated on a case-by-case basis but can be extended for up to 12 months from the date of the FR publication (if granted).
Click here to access our Section 301 Exclusion Comment Cheat Sheet.
What ingredients does the Exclusion Recipe call for?
The better the ingredients, the better the food!
In each of the Federal Register notices published thus far, the USTR has provided importers with exclusion extension comment form templates, which mirror the USTR portal where this information will be submitted. The forms ask importers to provide answers to a range of product-specific questions, which include:
- Rationale as to why you support or oppose this exclusion extension
- Are these products available to be sourced in the US? Provide support and any changes made to supply chain since July 2018.
- Any other relevant industry developments?
- Are these products or like-products available to be sourced in a third country?
- Are purchases from a related company?
- Quantity and Value of Chinese origin product from 201.
- Quantity and Value of Chinese origin product from 2019
- Quantity and Value of third country origin product from 2018
- Quantity and Value of third country origin product from 2019
- Quantity and Value of domestic origin product from 2018
- Quantity and Value of domestic origin product from 2019
- What efforts have been taken since July 2018 to source this product from the US or third country?
- Companies gross revenue in USD for 2018 and 2019
- Will these duties result in severe economic harm to your company or other US Interests? Please explain.
How long is the Prep time for commenting?
Every round of exclusion is granted a 30-day comment period for extension consideration beginning 60 days prior to the expiration of the exclusion.
If you don’t have every round of the exclusions memorized, don’t fret! You can find a breakdown of each round here.
But what makes this important information so Appetizing?
To date, Shapiro has already recovered an estimated $12 million in duties as a result of our exclusion post entry work. We believe that exclusions are something worth serving our customers; after all, it’s the perfect opportunity for importers to not only highlight the negative effects of additional duties, but to show them.
One of the most common questions we get asked by customers is should we import now or wait?
By monitoring the status of the Section 301 exclusions, you can better forecast for your future imports in both operational and financial planning. We know all too well that additional 7.5% or 25% duties can severely alter you future budgeting estimates. However, once you understand the ins and outs of each exclusion expiration, you will have a better idea of when cargo should be imported – which can be hugely beneficial for your bottom line.
No one like spoiled goods…so what are you waiting for? Let’s get cookin’!
Want to receive exclusion updates? Click here to subscribe to our Section 301 Exclusion Monitoring alerts!

Additional Resources:
- USTR Begins Preparations Ahead of the Sixth Round of Section 301 Exclusions Expiration Date (List 1)
- USTR Announces Eighth Round of Product Exclusions from Section 301 List 4A Tarrifs
With the Coronavirus upon us, global demand for supplies used to treat and help protect people, such as face masks and respirators, is currently exceeding supply. Fortunately, many manufacturers around the world have ramped up production to help get supplies where they are most needed.
Importing these products is not simple! Here’s what you need to know:
- Personal protective equipment for general purpose or industrial use (in other words, products that are not intended for use to prevent disease or illness) is not regulated by FDA. For these types of products, entry information should not be transmitted to FDA. At the time of entry for these products, Importers should transmit entry information to US Customs and Border Protection (CBP) using an appropriate HTS code with no FD Flag; or using an appropriate HTS code with an FD1 flag and do a ‘disclaim’ for FDA.
- Respirators and masks that are intended for non-medical purposes are regulated under the Occupational Safety and Health Administration (OSHA).
- Respirators and masks that are intended for medical purposes are a medical device and are regulated by the FDA.
- In order to import a medical device and products that emit radiation into the U.S., foreign manufacturers must meet applicable United States (U.S.) medical device regulatory requirements, even if the product is authorized for marketing in another country. Some of the requirements include Registration and Listing, manufacturing in accordance with the Quality System Regulation(QSR), medical device reporting of adverse events, and Premarket Notification 510(k) or Premarket Approval.
- Per the Who Must Register, List and Pay the Fee webpage, all establishments that are involved in the production and distribution of medical devices intended for commercial distribution in the U.S are required to register annually with the FDA. This includes the initial importer, the foreign exporter and the manufacturer, as applicable.
- Additionally, foreign manufacturers must designate a United States Agent, and all medical devices that are imported into the U.S. must meet Bureau of Customs and Border Protection(CBP) requirements.
- With a surge in demand due to the COVID-19 outbreak, the FDA has been facilitating the import of surgical masks, N95 respirator and any protective gear for medical professionals. When importing products authorized for emergency use pursuant to an Emergency Use Authorization (EUA), importers should transmit an Intended Use Code of 940.000: Compassionate Use/Emergency Use, and the appropriate product code that is currently authorized by an EUA for masks/respirators is NZJ.
- Firms who have applied for and received approval for specific products under an EUA are entitled to reporting of reduced FDA information when reporting Intended Use Code 940.000 (Compassionate Use/Emergency Use) and an appropriate FDA product code specific to pre-approved product.
- Be mindful that we are hearing reports of delays and refusals by FDA of KN95 mask shipments. KN95 masks are an equivalent Chinese-alternative to the scarce N95 mask. The following information should help in getting clearance for these items:
- FDA is using the CDC Strategies for Optimizing the Supply of N95 Respirators: Crisis/Alternate Strategies information to expand access, which includes KN95s. The link provides instructions on the entry process for KN95s, KN100s, KP100s, and KP95 Filtering Facepiece Respirators (Standard BG 2626-2006 NOT Under EUA). It identifies respirators approved under standards used in other countries that are similar to NIOSH-approved N95 respirators. CDC has determined these are suitable alternatives to provide protection during the COVID-19 response when supplies are short, when they conform to standards identified and provide a protection factor of at least 10. FDA does not object to importation and use of these respirators during the emergency.
- FDA cannot confirm the performance and quality of face masks and respirators not under an EUA. The only person who can verify the authenticity is whoever issued it.
- ACE Transmission Requirements for KN95s KN100, KP100, and KP95 NOT under EUA are as follows:
- Program Code: DEV
- Processing Code: NED
- Intended Use Code: 940.000 if the product is listed on the CDC website
- 081.001 if not listed on the CDC website
- Product Code: 80N-ZJ
- Use the Product Classification and Product Code Builder
- When importing products regulated by the FDA as a device, not authorized by an EUA, but where an enforcement discretion policy has been published in guidance, it would temporarily qualify for special discretionary handling by the FDA. At the time of entry, importers should transmit intended use code 081.006: Enforcement discretion per final guidance, and appropriate FDA product code. Under this Intended Use Code, the Affirmations of Compliance for medical devices (such as the Registration, Listing, and Premarket numbers) are optional in ACE.
- A list of respirators eligible for Emergency Use Authorization (EUA) is available in Appendix A and a list of respirators authorized under the EUA is available in Appendix B of the EUA’s letter of authorization.
- Requests for Emergency Use Authorization for diagnostic devices can be submitted to FDA at: [email protected]. Request for emergency authorization for non-diagnostic devices can be submitted to the FDA at: [email protected].
- If you are importing textile face masks without a replaceable filter or mechanical parts, including surgical masks and disposable facemasks made of non-woven textiles, the applicable subheading is 6307.90.9889 and the general rate of duty is 7% ad valorem.
- Recently, the USTR granted exemption from tariffs for a range of Section 301, List 4A medical products imported from China, including face masks, for single use, of textile fabrics. The exclusion eliminates 7.5% additional tariffs until September 1, 2020. A complete list of the announced exclusions involving medical products can be found here.
- For more information about face masks and N95 respirators regulated by the FDA, please visit the Masks and N95 Respirators
- For more information about US regulatory requirements for medical devices and radiation-emitting products, please visit the Overview of Device Regulation and the General Controls for Medical Devices
Please visit our Regulatory Compliance service page or reach out to [email protected] with any questions or for any assistance with the FDA process.
Additional Resources:
In 1919, people expected the year 2020 to be filled with high-speed trains, flying cars and seemingly utopic metropolitan areas. At the time, Prohibition advocates were fixated on banning the alcoholic content in beverages in an effort to improve what they viewed as a growing public health epidemic, while usage of fossil fuels perpetually increased in the name of innovation.
However, a century later, people are abundantly consuming alcohol, the world is still without flying cars and is instead left facing a much harsher reality – climate change. In a valiant attempt to tackle this new beast, governments and organizations are focused on banning the sulfuric content in fuel to combat the perceived declines in public and environmental health associated with climate change.
When it comes to life’s expectations versus reality, as the saying goes, hindsight is 20/20.
If we want to avoid the mistakes of the past, we should circumvent future assumptions, stay inquisitive and continue to ask ourselves the 5 W’s and the H (who, what, when, where, why and how.)
Let’s Get Started – The Who, What, When and Where of IMO 2020
The maritime community is facing a precarious blind spot as it approaches January 1st, 2020 – the date on which the International Maritime Organization (IMO) will begin its enforcement of lowered sulfur limits on “bunker” fuel for vessels. The new global limit will decrease the current maximum limit of 3.5% down to 0.5% sulfur content.
Sulfur Limitation Timeline
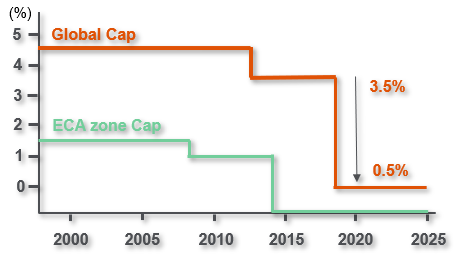
In addition to the global sulfur cap, designated Emissions Control Areas (ECAs) in North America and Europe will begin enforcing an even lower limit of 0.1%. Other areas, such as China, are expected to receive the ECA designation after the new cap has been implemented.
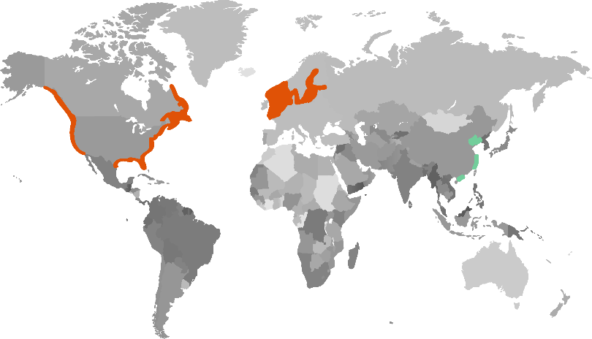

Why? – The rising environmental and health concerns of ‘bunker oil’
‘Bunker oil’ is the lifeblood of global shipping fleets but is also a significant contributor to sulfur oxide (SO) emissions. The IMO recognizes sulfur oxide emissions as detrimental to human health, as it is one of the many contributing factors of increased respiratory issues on a global scale. Experts also surmise that SO emissions are a leading cause of heightened acidity levels in rain, which can result in crop failure and ocean acidification, harming the environment and global food production.
How #1 – Carriers’ options for compliant fuel
Vessel owners have a number of options for compliance, but each solution has its own tradeoff.
Option 1: Carriers can switch to liquified natural gas (LNG), which is a cleaner, lower pollutant, but is also a more expensive alternative to bunker fuel. Unfortunately, global refueling infrastructure is limited, and the higher cost of fuel means this alternative has a high variable cost, which will lead to higher total costs compared to other solutions in the long term.
Option 2: Exhaust Gas Cleaning Systems (EGCS), often referred to as “emission scrubbers”, reduce the amount of SO emissions to be in line with IMO 2020 requirements. However, the resulting increase in fuel consumption, CO2 emissions, and water pollution can prove costly. Additionally, not all vessels can be retrofitted with the technology, so while emission scrubbers can be a suitable bridging technology at present, the long-term sustainability of the approach is questionable.
Option 3: Alternatively, vessel owners can make the switch over to low sulfur compliant fuels. Variable and fixed cost calculations make this alternative the clear winner, but global sources are limited, and the costs are still higher than existing bunker fuel (although costs are expected to decline as more infrastructure and sources are developed).
Vessel Owners’ Options for Compliance with IMO 2020 Requirements
| Option | Trade-off |
| Liquified Natural Gas (LNG) |
|
| Exhaust Gas Cleaning Systems (EGCS) – “Emission Scrubbers” |
|
| Low Sulfur Compliant Fuels |
|
How #2 – (How) do I calculate the Low Sulfur Surcharge (LSS)
Each carrier has individually developed their own low sulfur surcharges (LSS) to recoup the costs of fuel compliance, which is generally priced by a calculation that incorporates the cost of fuel (per ton), as well as a ‘trade factor’, established using the average fuel consumption of each specified trade lane.
Carriers already started the conversation surrounding these new fuel surcharges with BCOs (beneficial cargo owners) and NVOCCs, in coordination with the onset of the 2019-2020 contract season.
Shippers will soon begin to feel the financial squeeze of increased fuel costs as carriers race to prepare ship emission systems or acquire compliant fuel supplies.
Carriers exploring other alternatives to offset costs
Carriers have had a roughly 50% success rate when enacting fuel increases in the past. To avoid further failure or risking a Hanjin-style bankruptcy, many are exploring other means of mitigating operating expense increases. 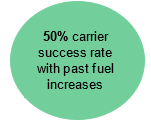
Currently, they’re considering ‘slow-steaming’ and transshipments – two interlinked cost-control approaches.
Historically, operators often run vessels at slower rates of speed to conserve in the face of fuel price fluctuations, much to the chagrin of shippers tasked with managing the longer ocean transits as a result. Carriers then seek to mitigate and control the lost time (at least on paper) by emphasizing the transshipment of containers at central ports, creating a hub-and-spoke logistics network of feeder vessels traveling to and from these larger ports more frequently.
However, the reality is that this wreaks utter chaos on sailing schedules. Internal evaluation of our own data suggests that Shanghai transshipments average 3-4 days more than the posted averages from carriers, primarily due to mother vessel delays and delays in feeder service, with outliers even suffering through weeks of dwell time.
What’s even worse is if your container is ‘blessed’ with multiple transshipments, delays are compounded and could account for nearly a week of transshipment port dwell time, even if transshipment dwell times at each port fall within the average window.
2020 Foresight – how will longer, more variable transit times impact shippers?
Shippers should prepare to see 2 primary impacts:
- Extended lead times to customers, which could necessitate larger orders or more expedited orders to ensure a stable replenishment program. With retailers increasingly following Walmart’s lead on “On-Time and In-Full” (OTIF) delivery policies for suppliers, late deliveries due to ocean transit could even result in financial penalties levied against the invoiced value of the goods. Beware – shippers who have moved production more inland or to nascent Chinese competitors in an effort to offset or avoid the costs associated with Section 301 tariffs, but must now contend with smaller ports and potentially one or more feeder services to reach their customers.
- Financial risk for shippers buying from their suppliers on Free-on-Board (FOB) terms from the port of origin, as the longer lead time to sale extends the cash-to-cash cycle time. Shippers will be assuming the financial burden of the goods for upwards of a week longer than previous shipments.
While these options seem like the worst-case scenario, research comparing the fluctuation of bunker fuel prices to the potential for transshipment suggests that carriers have and will use transshipments as a tool to cut operational expenses.
Bracing For Impact
Has our country learned a thing or two about planning since 1920s Prohibition? Who knows. What we do know is that the 104 years of experience we have under our belts has prepared Shapiro to be in the business of adapting to today’s changing world.
Shippers best positioned to absorb the blow of the IMO 2020 changes will be those who work most closely with their supply chain partners to select the best routings, understand how to adequately mitigate the risk of transshipments, and to proactively review routings from feeder ports to assist in predicting the impact of lengthier delays.
If you need assistance navigating the choppy waters of low sulfur fuel, contact our marketing experts today and remember… We Deliver. Problem Solved.