PICTURE THIS…It’s 1973. You’ve just arrived at your health-conscious Uncle Larry’s house for the weekend—and are less than enthused when you hear all about the new superfood blender that your uncle won in a raffle at his gym. He then proceeds to offer up one of his “World Famous Larry-aids,” which is loaded with fruits and veggies, and is guaranteed to make you a “lean, mean, fighting machine.” What do you do?
Let’s be real—back in ‘73, most people would have had to fight off a look of sheer horror at the prospect of having to drink something that tasted like feet—and then proceeded to politely decline. But fast forward to today, and the response would probably be much different.
Just as the food pyramid has evolved to promote a healthier lifestyle over the last 50 years, so too has the importance of sustainability in bettering the planet.
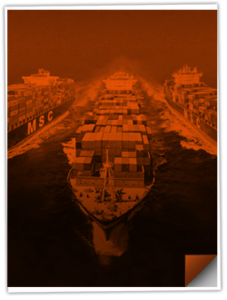
Take the shipping industry, for example, which has long relied upon massive steamships to traverse the world’s oceans, thereby producing significant carbon and sulfur emissions. The resulting environmental decay has contributed toward the relatively recent emergence of green organizations—such as the Global Reporting Initiative (GRI), the International Maritime Organization (IMO), and the Sustainability Accounting Standards Board (SASB)—thereby enabling us to navigate the treacherous and uncharted (and filthy!) waters with our global partners.
If you haven’t heard about some of the latest and greatest green global initiatives yet, then sit back and enjoy the “smoothie” sailing, as we set the course on “clean, green, pollution-fighting marine machines.”
It’s a Bird, It’s a Plane…No, It’s Ocean Sustainability!
As the saying goes, “birds of the [Exxon Valdez Oil Spill] feather flock together.” (Okay, yes, we might have taken a few liberties there, but we thought we would try to be “slick” and lighten the mood before we “spill.”) Has a little birdie from a flock of “sea”-gulls—ever told you about the 11 million gallons of oil that leaked from a tanker that had run aground in Alaska back in 1989? If not, then you are likely unaware of the environmental devastation that the Exxon Valdez Oil Spill caused.
The resulting public outcry was so sweeping that it led to the establishment of the Global Reporting Initiative (GRI). Although the GRI is completely independent, it acts as a compass, providing a sustainability reporting framework for companies, allowing them to disclose certain environmental, social, and governance impacts. In a nutshell, the GRI provides shippers with the ability to constructively compare apples-to-apples when it comes to core sustainability progressions.
It wasn’t until the 1990s that “sustainability” became a buzzword. CEOs went unchecked for years as they shouted it from the rooftops in the name of soaring stock prices.
In those days, there was little to no oversight or ability to compare the effectiveness of sustainable initiatives from company to company. It wasn’t until the Sustainability Accounting Standards Board’s (SASB) debut in 2011 that companies were able to measure, manage, and communicate the most relevant and impactful factors to their industry, also known as Environment Social Governance (ESG) factors. Here’s a birds’-eye-view of a few ESGs:
View Environment Social Governance Chart
| Topic | Metric | Category | Unit of Measure |
| Greenhouse Gas Emissions | Gross global Scope 1 emissions | Quantitative | Metric tons (t) CO2-e |
| Discussion of long and short-term strategy or plan to manage Scope 1 emissions, emissions reduction targets, and an analysis of performance against those targets | Discussion & Analysis | N/A | |
| Quantitative | Gigajoules (GJ), Percentage (%) | |
| Average Energy Efficiency Design Index (EEDI) for new ships | Quantitative | Grammes of CO per ton- ₂ nautical mile | |
| Air Quality | Air emissions of the following pollutants:
| Quantitative | Metric tons (t) |
| Ecological Impacts | Shipping duration in marine protected areas or areas of protected conservation status | Quantitative | Number of travel days |
Percentage of fleet implementing ballast water:
| Quantitative | Percentage (%) | |
| Quantitative | Number – Cubic meters (m³) | |
| Employee Health & Safety | Lost time incident rate (LTIR) | Quantitative | Rate |
| Business Ethics | Number of calls at ports in countries that have the 20 lowest rankings in Transparency International’s Corruption Perception Index | Quantitative | Number |
| Total amount of monetary losses as a result of legal proceedings associated with bribery or corruption | Quantitative | Presentation currency | |
| Accident & Safety Management | Number of marine casualties, percentage classified as very serious | Quantitative | Number – Percentage (%) |
| Number of Conditions of Class or Recommendations | Quantitative | Number | |
Number of port state control:
| Quantitative | Number |
The above ESG standards emphasize materiality; this means they tend to focus on issues most likely to affect a company’s financials and shareholders. When you tie non-financial factors and incentives to performance, companies are more likely to take sustainability seriously—which ultimately trickles down and benefits society.
Synchronized Diving with the GRI and SASB
There are some things in life that are simply better together—such as peanut butter + jelly; bacon + eggs; or Beyonce + Jay-Z. When it comes to the ocean, there are few matches as “nauti”-cool as the compass and map. You can have one without the other, but both are more useful when paired together.
With this in mind, let’s imagine that the SASB standards function as the Sustainability Compass—which acts as a tool to help navigate the GRI Framework Map.
Realizing the incredible power of their complementary nature, in July 2020, both organizations teamed up to announce a collaborative work plan. Together, they aim to:
- Clarify the application of their reporting standards;
- Provide insight into how the performance data is used; and
- Help consumers of the data understand the similarities and differences in the information generated.
Over 96% of the world’s largest companies report on sustainability performance. It’s clear that the ripple effect from both organizations is starting to make an impact on a global scale.
The Ins- and Out-Comes of Sustainable Shipping
Peter Drucker took a page out of Patrick Henry’s book when he said, “Innovate or die.” While we don’t want to necessarily over-dramatize the situation, there have been many notable advancements in the industry over the last few decades—including hybrid engines, alternative fueling, slow-steaming coupled with route optimization, and utilizing sustainable packaging and materials.
Oftentimes, hybrid engine technology is a somewhat controversial table topic, especially if Uncle Larry still has his prized ‘76 Nova parked in the garage. Politically charged commentary aside, these engines offer a promising solution to minimize the carbon footprint of ocean vessels.
Did you know that ocean shipping alone is responsible for 15% of carbon emissions across the planet? Or that in its lifetime, a single ship contributes almost as much pollution as 50 million cars would? Taking advantage of hybrid technology is an easy double-win for companies. Not only does this reduce carbon emissions by up to 40%, but it also increases fuel efficiency by as much as 30%, resulting in a boatload of savings across the board… which results in another boatload of savings.
In quite the juxtaposition, the slow steaming of vessels has been quick to pick up speed in the shipping world. As its name suggests, slow steaming occurs when a vessel intentionally reduces its speed during transit to optimize fuel expenditure and reduce greenhouse emissions. Some experts estimate that this strategy can reduce fuel consumption by an average of 30% per trip. Much like the hybrid alternative, slow steaming can lower environmental impacts and cut fuel costs relatively effectively and quickly. Additionally, it puts less stress on the ship’s engine, which can extend its lifetime.
The Wrap-Up: Life in Plastic Ain’t Fantastic
Before we wrap-up on this topic, (or start rapping the rest of Aqua’s “Barbie Girl”), let’s quickly touch on packaging materials and methods that have entered the sustainability scene. It comes as no surprise that traditional packing approaches—like bubble wrap or polystyrene—have faced increased criticism in recent years due to the potential wildlife hazards they present, as well as their limited recyclability. Many companies have opted to use more environmentally friendly packaging materials, such as air pillows or recycled paper and plastics, when shipping their products.
As we head deeper into the twenty-first century, the days of massive steamships belching out noxious fumes grow fewer and fewer; however, the lasting trail of global emissions and pollutants remains firmly in their wake. Just like your Uncle Larry’s pursuit of health, the shipping industry is undergoing a transformative journey towards a more sustainable future on the vitamin “sea”— one that’s loaded with clean, green, pollution-fighting marine machine juices.
View More Supply Chain Resources!
Explore all our tips and training guides to help you navigate the world of regulatory compliance laws and international laws.


