Supply Chain Buckles Under Consumer Demand
Supply Chain Reactions
A Condensed Update For American Shippers
Issue Date: December 8, 2021
Quote of the Issue:
“…too many of us now tend to worship self-indulgence and consumption. Human identity is no longer defined by what one does, but by what one owns.”
– Jimmy Carter.
Demanding Times for Import and Consumer Demand Forecasters
ShapLight Focus: US household debt rose to an all-time high of $15.24 trillion between July and September
- The cost of goods in the US as measured by the consumer price index rose 6.2% year-on-year in October—the fastest annual growth rate since 1990
- The Federal Trade Commission (FTC) has launched a probe into what has caused “empty shelves and sky-high prices”; the information requests were sent to nine of America’s largest importers and focus on “strategies related to global supply chains”
- Since April, US wages have grown an average of 12% in 2021 vs. 2020
- Despite highly anemic Black Friday results, overall holiday shopping spending remains 10% higher year-on-year in 2021
- A Tale of Two Demand Types: While up 17.3% since February 2020, demand for durable goods is down 12.7% since March 2021; demand for non-durable goods, however, continues to increase and is currently 14% higher than February 2020
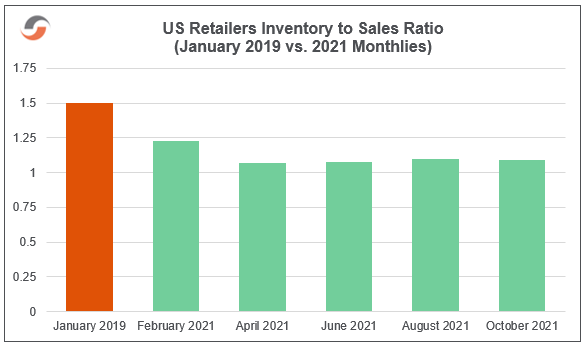
- While US ports set records for importer volumes, the retailers’ inventory to sales ratio remains stubbornly low compared to January 2019; please note our trending chart for the ratio in 2021:
Global Governmental Odds, Ends, Ways, and Means
World Trade Organization (WTO) summit in Geneva due to Omicron fears; the notable agenda items include deregulation of vaccine trade, essential improvements for decreased agricultural protectionism, and a broad-based empowerment of the WTO itself
- More than 350 global Harmonized System numbers, affecting 1500 US tariff codes, are set to change on January 1; the greatest number of changes will occur for electrical machinery and parts, wood, textiles, and organic chemicals
- China’s factory activity unexpectedly increased in November after three months of regression due to governmental power rationing and a tremendous surge in the cost of raw materials; November exports were up 22% compared to a year ago
- YTD Chinese exports by value to the US are up 28.3% vs. 2020, while Chinese imports from the US have increased by an impressive 36.9%
Ocean Needs a Potion for Motion
ShapLight Focus: Vessel waiting time for a berth at Los Angeles/Long Beach (LA/LGB) has reached an average of 18.8 days after averaging 13.4 days a month ago; this has fueled speculation that steamships are simply slowing down in the Pacific and that recent reports of congestion diminishment are largely symbolic
- Additionally, the average size of vessels at anchor in Southern California has increased sharply; more than 50% of the vessels in the harbor are over 10,000 TEUs, which is up from 20% recorded in August
- After two weeks of frequent rain closed two major highways and crippled rail capabilities due to flooding and mudslides in Vancouver, Mother Nature decided to dump some more rain on British Columbia; port officials fear that normal cargo flows will not be possible until January or February of 2022
- Cargo volume handled in Oakland was down 20% with 43% fewer ships arriving when compared to 2020 as steamship lines bypass the port and head back to Asia after prolonged delays in LA/LGB
- The Pacific Maritime Association (PMA)— which represents 70 carriers and terminals in 29 West Coast ports— proposed a one-year contract extension, through July 1, 2023, to the International Longshore and Warehouse Union (ILWU); the ILWU and their 15,000 members immediately rejected the offer
- In a desperate sign of the times, CMA/CGM is offering incentives for any shipper who can remove their container within eight days of arrival in LA ($100 per box picked up during the day and $200 for nighttime pick-ups); the program is expected to cost $22 million, though the carrier did not comment on the increased profits generated by faster turns
- Three quarters into 2021, Maersk’s year-to-date revenue stands at $43 billion with pre-tax earnings at $16.6 billion and growing
- According to Sea Intelligence, Inc, the combined operating profit of steamship lines hit $37.24B in Q3 2021; this number eclipses the combined profits of all carriers from 2010-2020
Air Export Rates Out of China at Record Highs
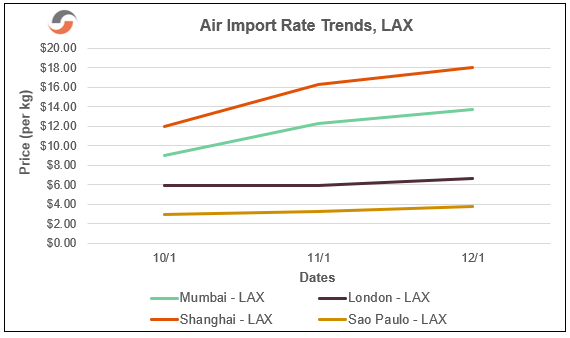
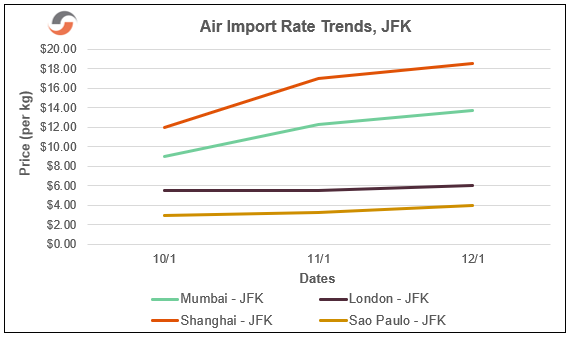
ShapLight Focus: The average rates from all major Chinese gateway airports (Shanghai, Hong Kong, Shenzhen) sit between $17 and $20 per kilo with no expectation of diminishment until Chinese New Year; these are the highest sustained rate levels on record
- Airfreight volume out of Asia is 22.3% higher year-on-year with spikes of over 50% for electronics, medical supplies, and e-commerce goods
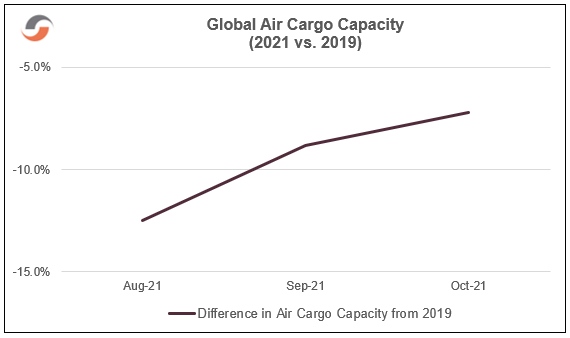
- Global air capacity is down 7.2% due to the continuing reduction in passenger flights
- Global airfreight volume is up 9.4%; this combined with lower capacity has allowed airlines to establish and maintain the highest average air rates globally in history
- Despite impressive air cargo profits, the airline industry is forecast to lose $12B in 2021; the good news is that this is a 78% improvement over 2020
- Global dynamic load factors (derived from a combination of weight and space) eclipsed 80% in November, indicating a successful focus on the efficient use of airline assets
US Domestic Landscape Shifting to Retail/Wholesale/Warehousing
ShapLight Focus: Total domestic ton-mileage has shifted by 10 percentage points away from manufacturing and mining in favor of retail/wholesale/warehousing; after decades above 70%, the manufacturing and mining sector now accounts for just 60% of US ton-miles
- After adjusting for cost-of-living and inflation, it is estimated that truckers are paid 40% less today than they were before deregulation in the late 1970s
- Turnover for truck drivers working for companies with $30 million in revenue or more sits at a staggering 92% nationwide
- The Union Pacific Railroad (UP) has commenced testing semi-automated cranes at Chicago’s Global IV rail terminal; congestion has crippled Chicago during the cargo surge
- Cass estimates that prices across all domestic modes are up 31.4% in 2021 vs. 2020
- Warehouse vacancy rates in Southern California sit below 0.5%, with rents in that sector up more than 50% since January
- 27% of the world’s shipping containers passing through ports globally are empty
- Every $1B in online sales requires 1M square feet of warehouse space; with US e-commerce sales breaking records above $900B, this means that the current warehouse space in the US devoted to e-commerce is twice as large as the island of Manhattan
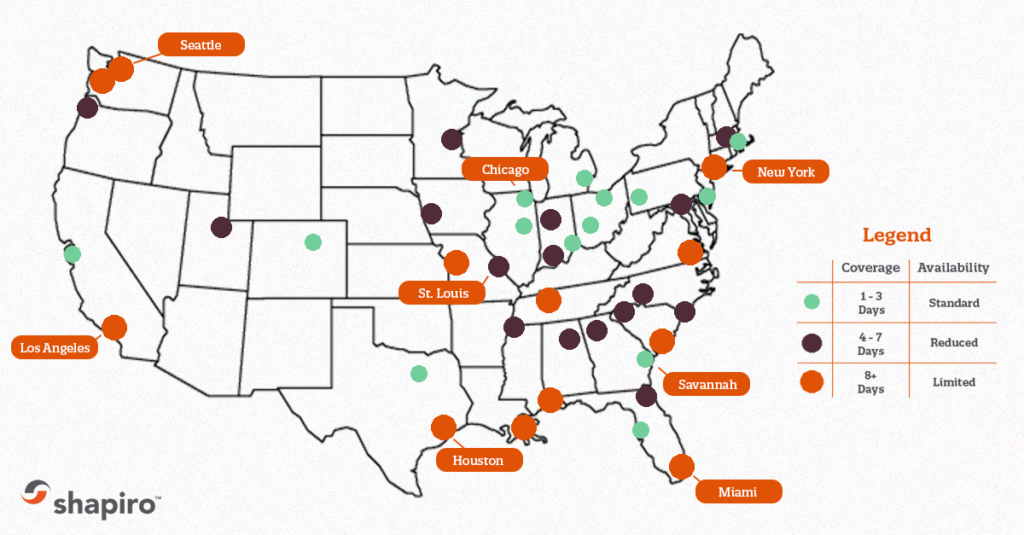
Please note our ‘Orange Crush’ Map of US Drayage Backlogs:
Import Freight Rate Trend Charts
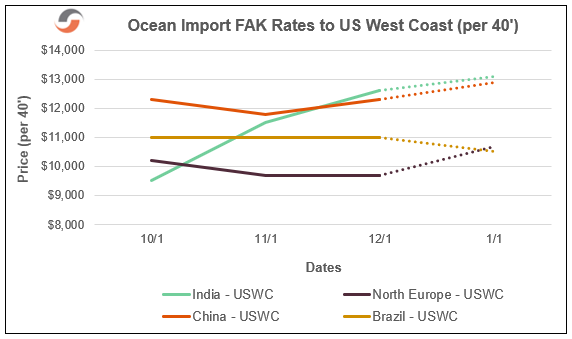
Ocean Import FAK Rates to US West Coast (per 40’):
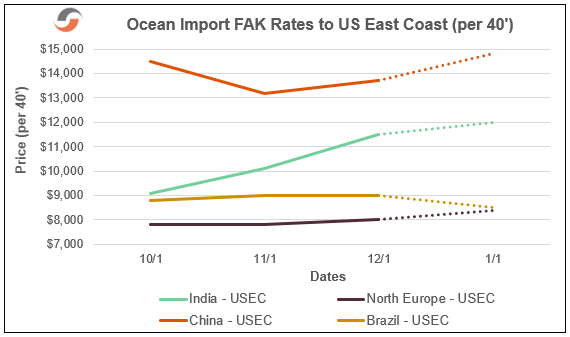
Ocean Import FAK Rates to US East Coast (per 40’):
Air Rate Trends
Our Expert Shapinion

Steamship Goliaths Said to be Favoring BCO and NVO Goliaths
Carrier giants are coming to the painful conclusion that despite their growing capacity and huge financial muscles, they will not be able to carry current contract minimum quantity commitments (MQCs) in the 2022-2023 contract year.
While only Maersk and Hapag Lloyd have publicly proclaimed the strategy, many steamship behemoths are making moves to eliminate or downsize contracts for certain shipper-types— namely the “Davids”, the underdogs, the size-challenged crowd amongst shippers and NVOs.
Industry observers expect ocean carriers to eye shipper colossuses with colossal desire since larger BCOs and global NVOs have deep enough pockets to risk multi-year contract gambles for capacity at today’s elevated rates. The carriers have never had as much leverage as they have today, and they are eager to manage future demand while preserving higher rates, despite highly uncertain future consumer demand and gargantuan capacity increases from new mega vessels looming in 2023.
Carrier Goliaths have grown dependent on high-cost charter deals to take better advantage of today’s surge and, while operational blank sailings effectively manage supply, they are very costly. Additionally, most carriers are very eager to reduce operating costs by digitizing booking and documentation products and services. Goliath believes that a shorter list of fellow giants is the best means to mitigate risk while simplifying back-office operations.
…Where Does that Leave Shippers and Smaller NVO Davids?
Despite their relatively diminutive size, smaller shippers and NVOs move the majority of global cargo, yet this size-stunted population can expect drastically reduced MQCs next year if they get a contract at all! This means that these shippers will be hunting for space one slingshot load at a time—a transactional nightmare that painfully echoes 2020 and 2021.
So, why are many supply chain pundits placing their bets on David? If at any point in the current shipping cycle the market weakens and spot rates soften, the adorable leprechauns of the industry, unburdened by long-term carrier contracts, will be the first to benefit from a commoditized market—the one created by Goliath to serve Goliath. We have already witnessed flattening prices for spot rates and FAK over the last six months, and there is no reason to expect an endless rate climb into 2022.
Once the market weakens, mammoth shippers may well view their long-term contract locks as handcuffs, and one imagines a battle to end all battles between Goliath and… well, Goliath. Who needs a slingshot when Goliath is fighting himself? Yes, the ocean giants will lower contract rates in this scenario, but it’s very hard to imagine that those reductions will reach the potential low ebb of the spot market.
David will ultimately triumph when the supply/demand imbalance swings back in favor of normal-sized shippers during the next contract cycle and ocean carrier monoliths will more aggressively pursue dancing pixie shippers after they (we) lay down our slingshots. At the end of the day, especially after the capacity flood of 2023, Goliath will have experienced a downturn in demand and an inevitable shortfall of MQC, and this will put David back in the spotlight for favorable rates and services. Long live David!
Shap Fact of the Issue:
According to Adobe, “out of stock” messages on retailers’ websites are up 172% this year. As a result, online sales of second-hand goods in the US are trending to smash previous records and hit $65 billion in 2021.
The leadership and staff of Shapiro understand the personal and business anxiety each of you is experiencing. We want nothing but safety and a return to normalcy for you and your families. Please reach out to us if you have any questions—or if we can assist you in any way.
